What have we done?
Projects
Below are a sample of recent projects, some tools have been genericised, any data displayed is dummy data, some images intentionally blurred
Project 1
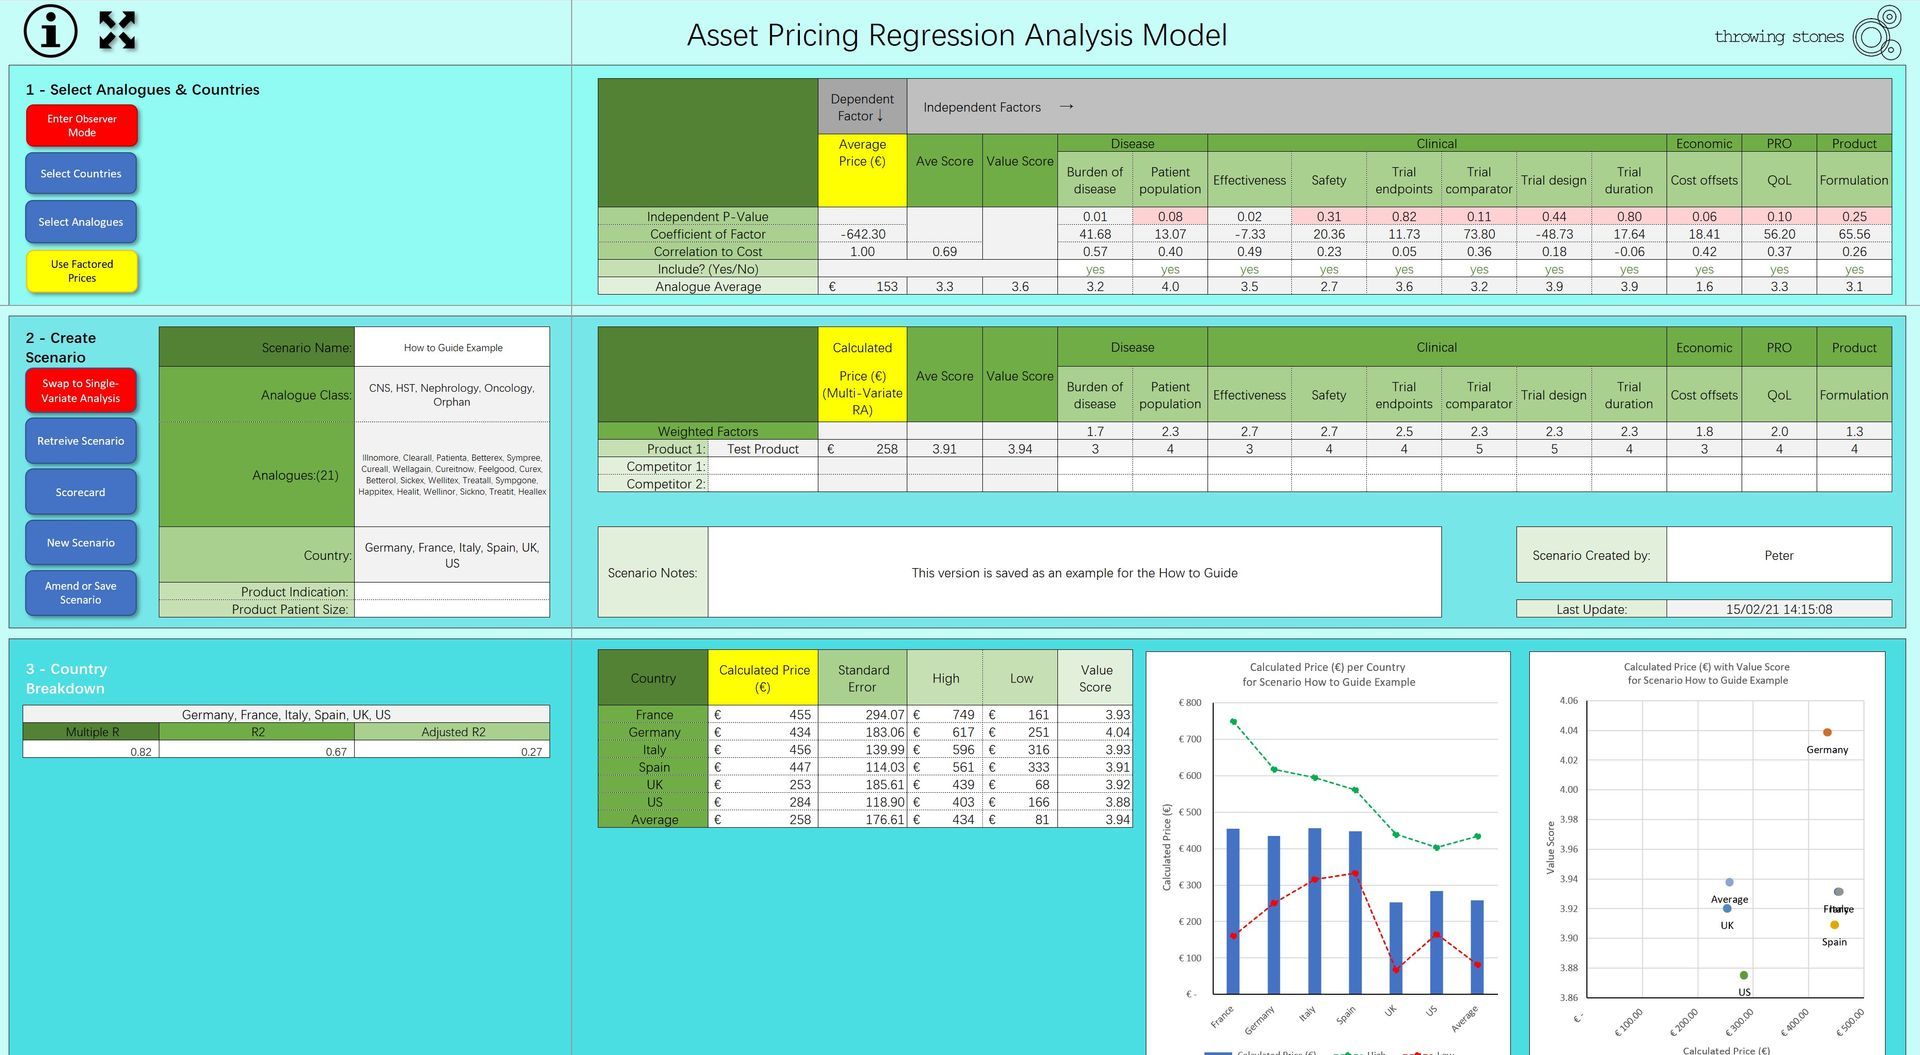
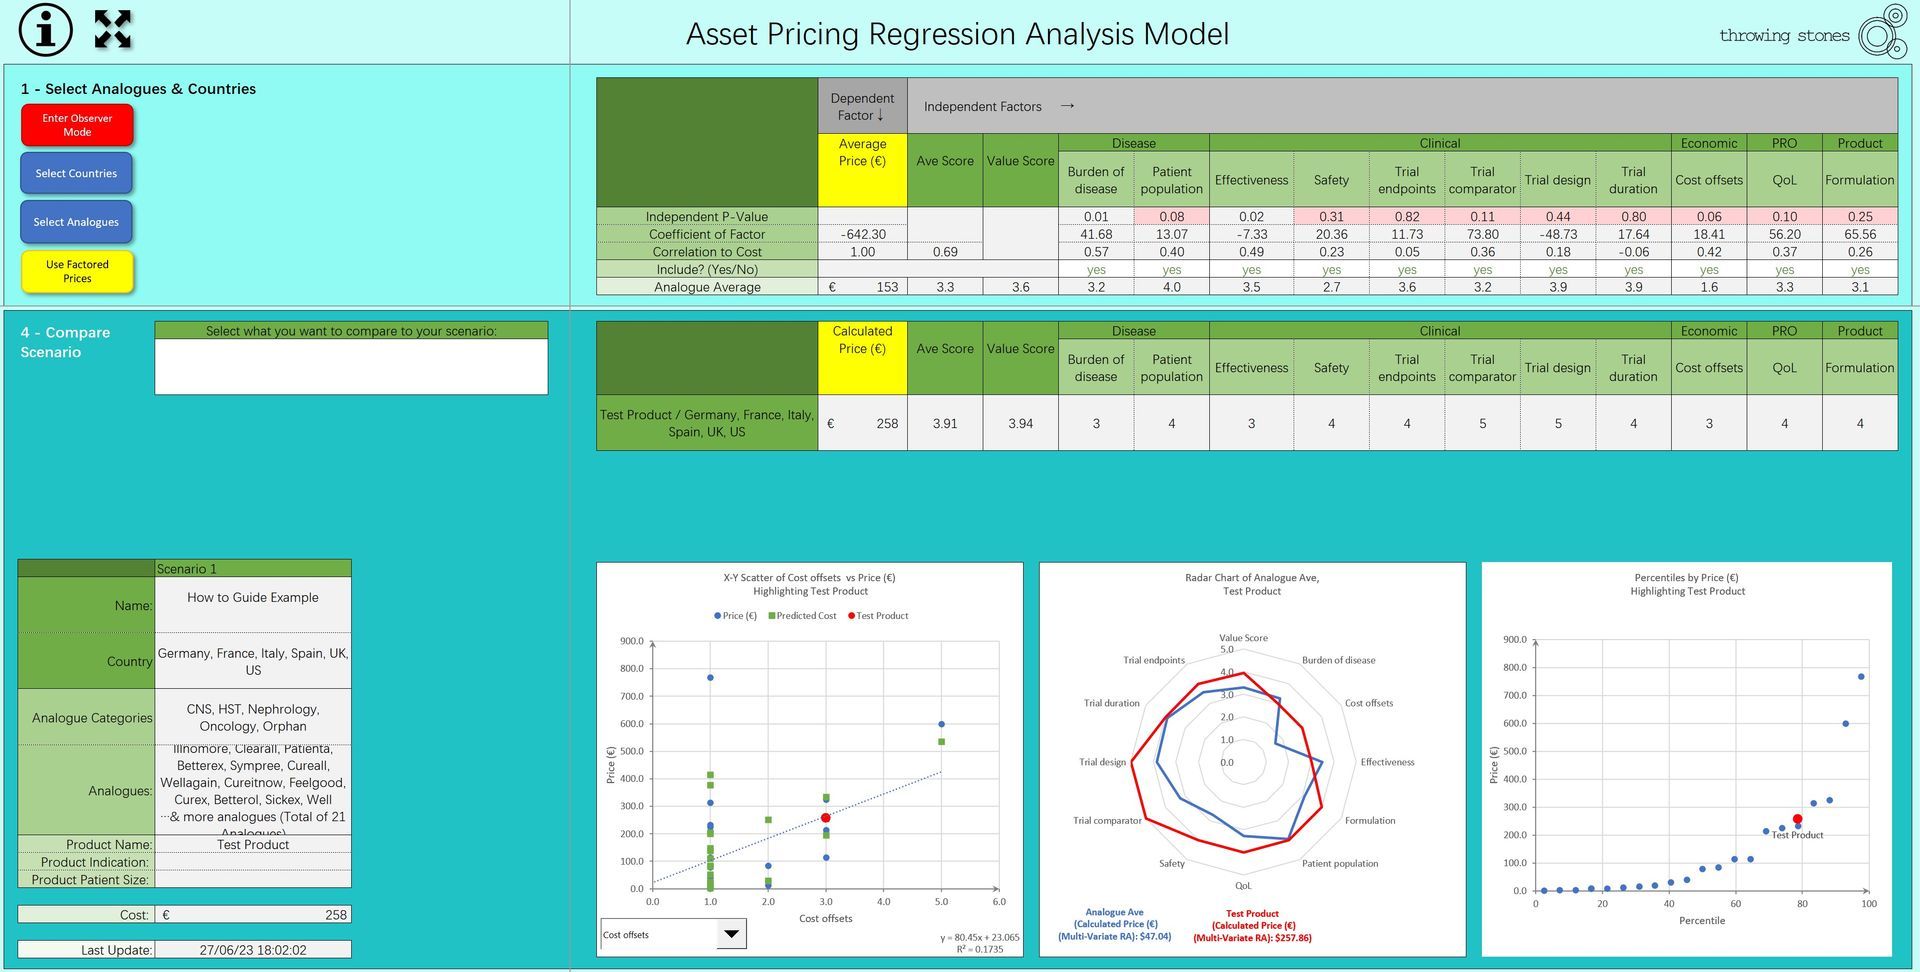
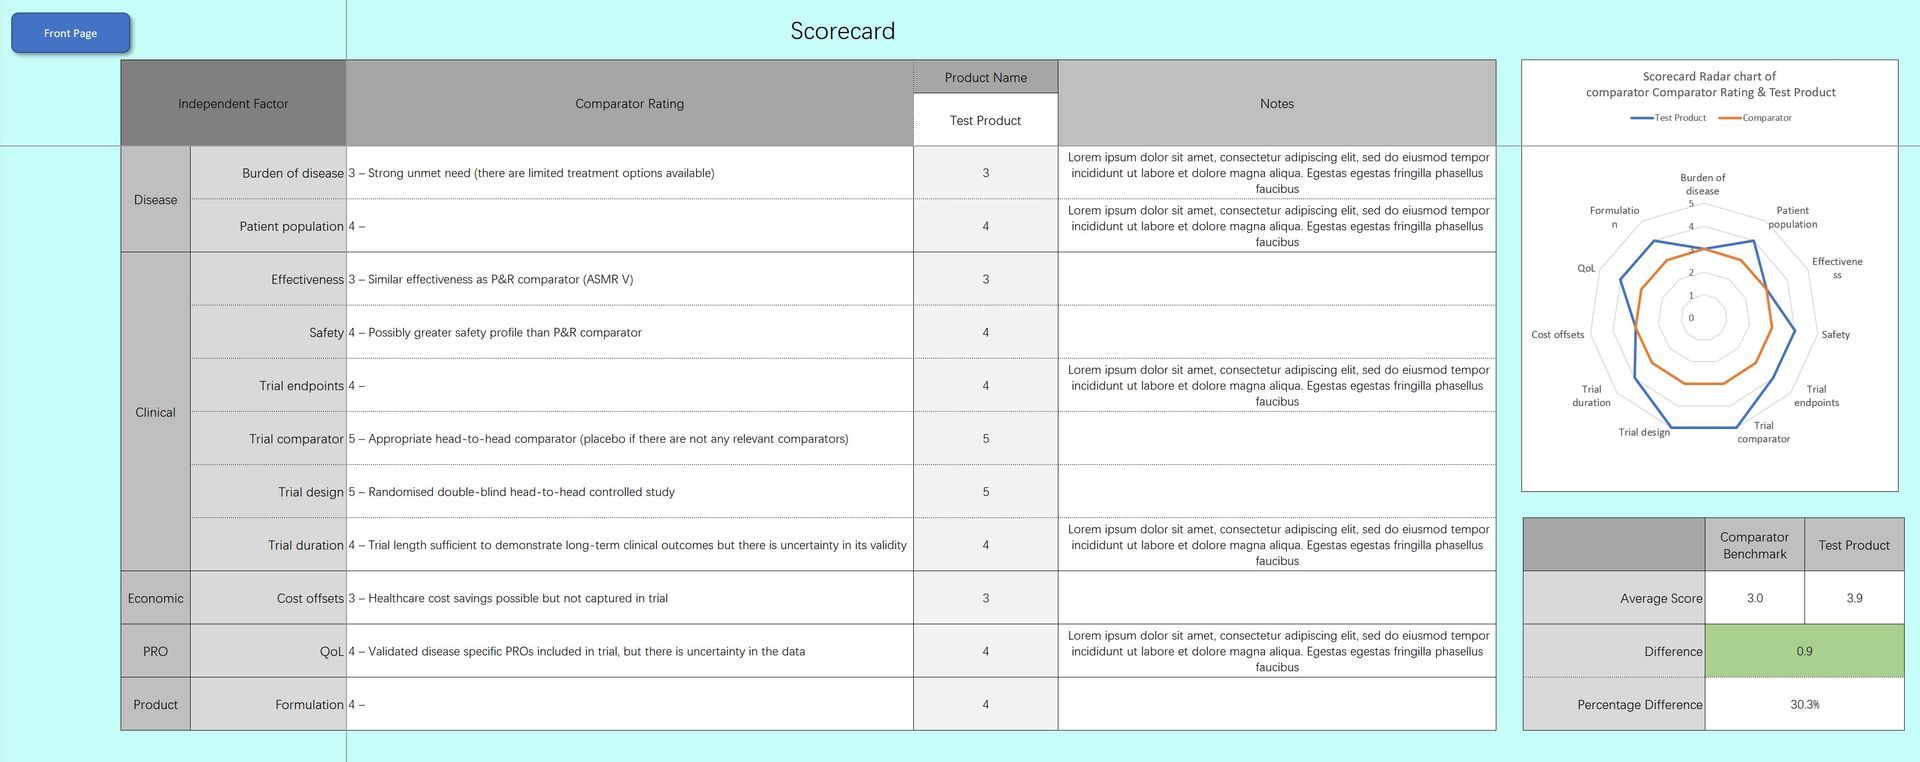
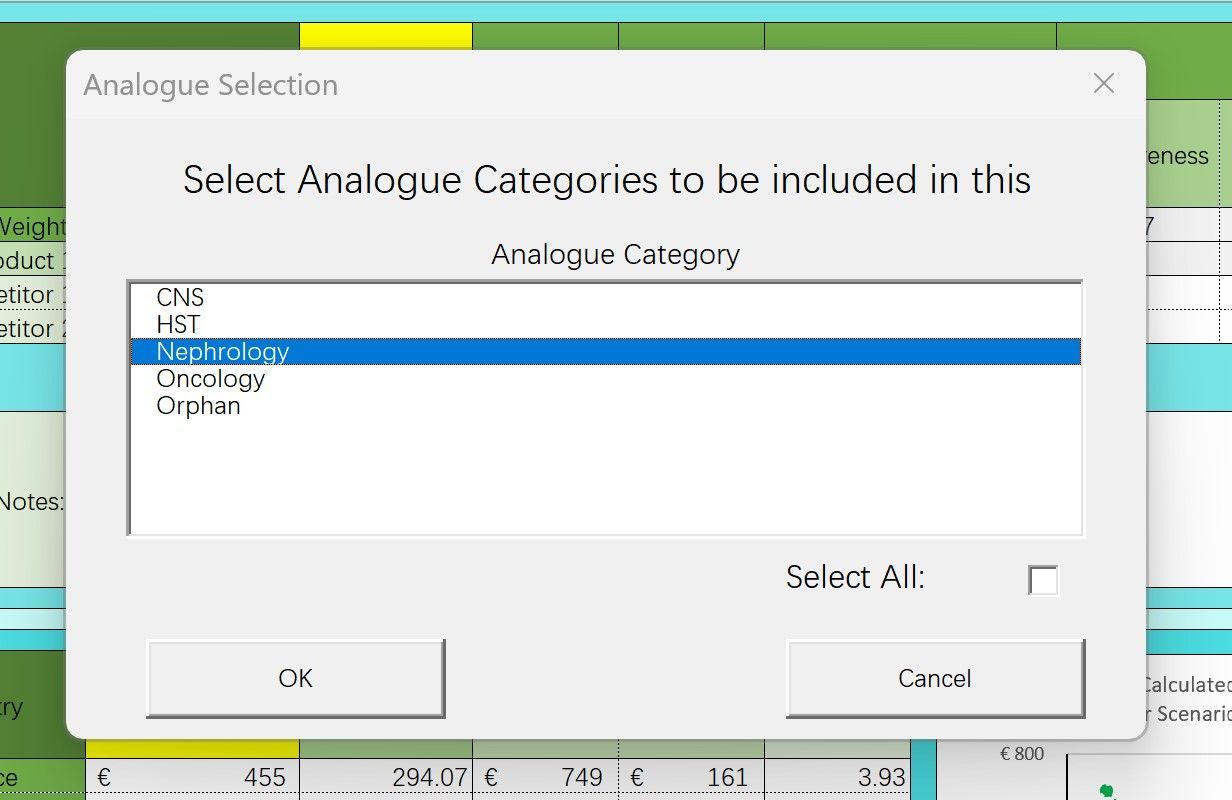
Regression Analysis Pricing
A Top Tier Pharma company wanted to be able to estimate the price of potential new assets based on multiple factors and comparators from analogues within specific markets and surrogates from alternative markets. We designed a regression analysis methodology and model that compared multiple independent factors from a selectable database of products and markets using actual and factored pricing to give an indicator of asset value. All calculations were held in an internal database to enable easy version control and instant scenario recall
Project 2
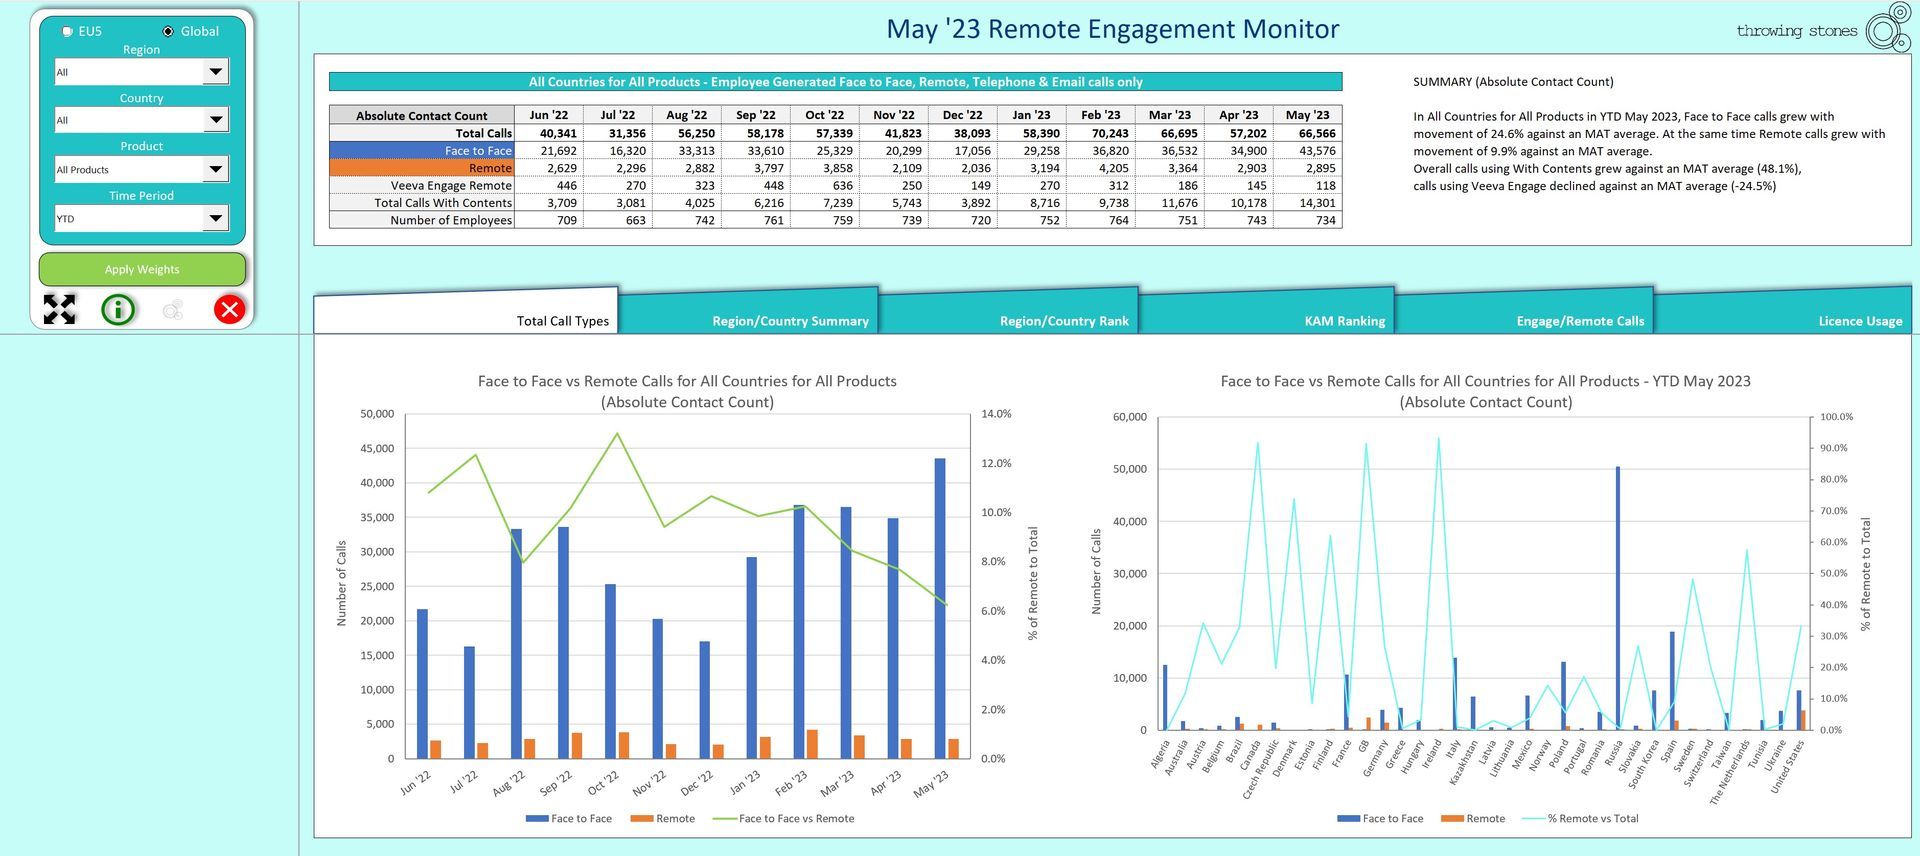
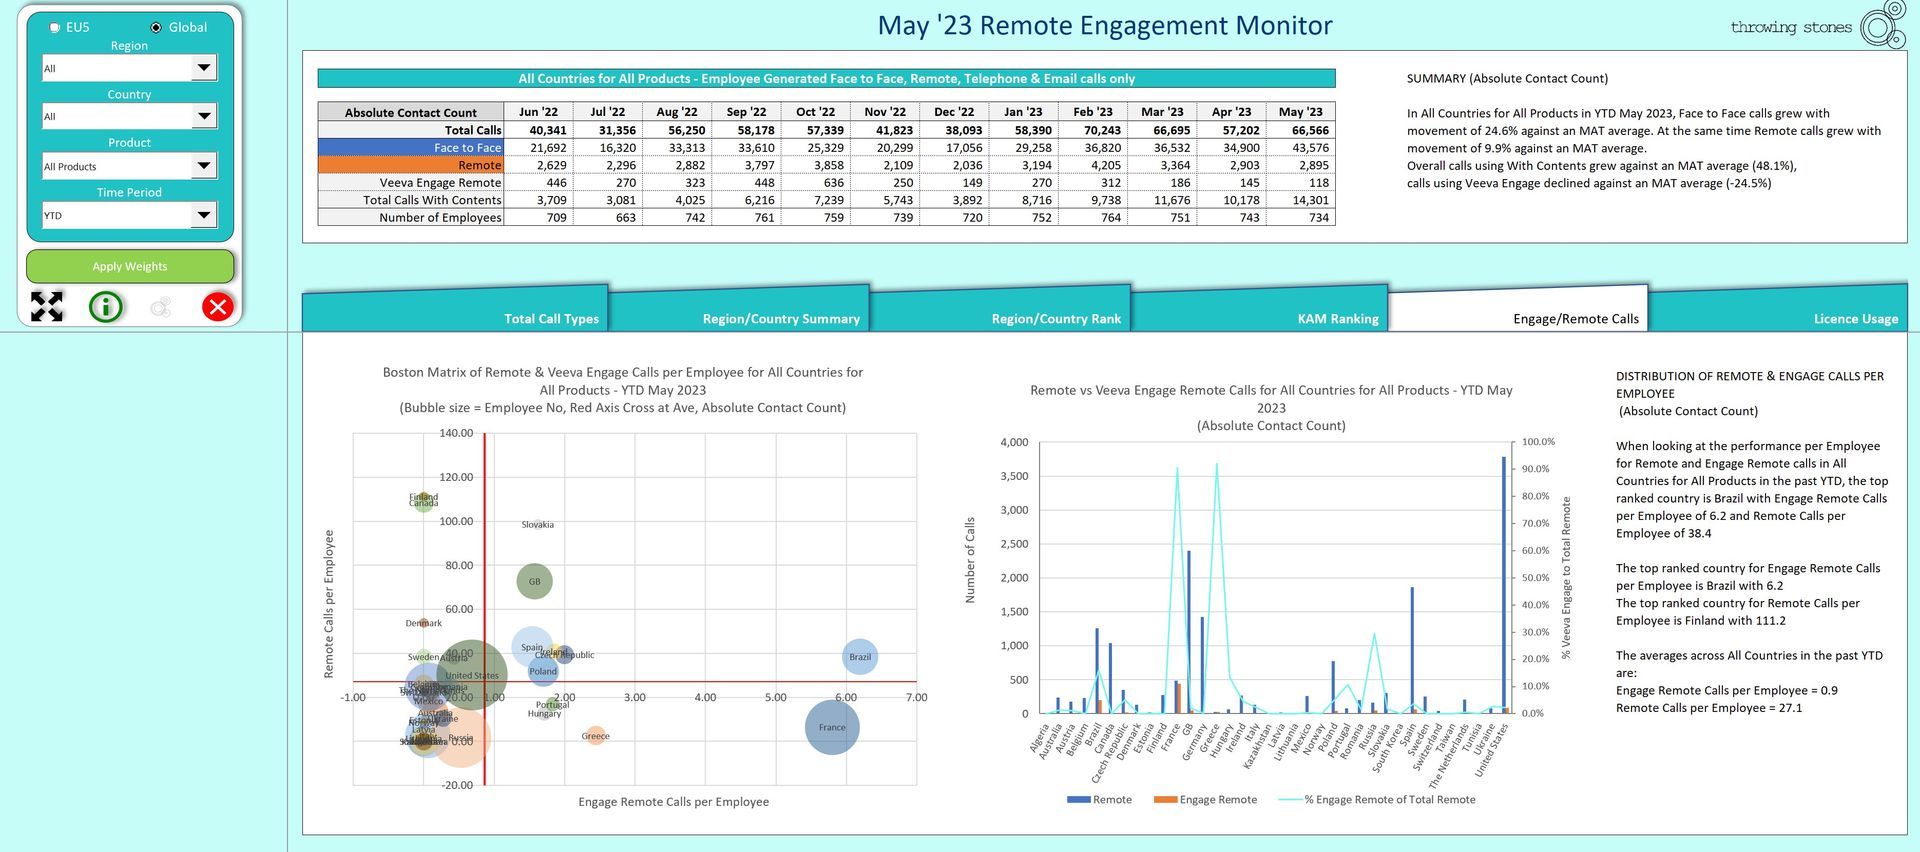
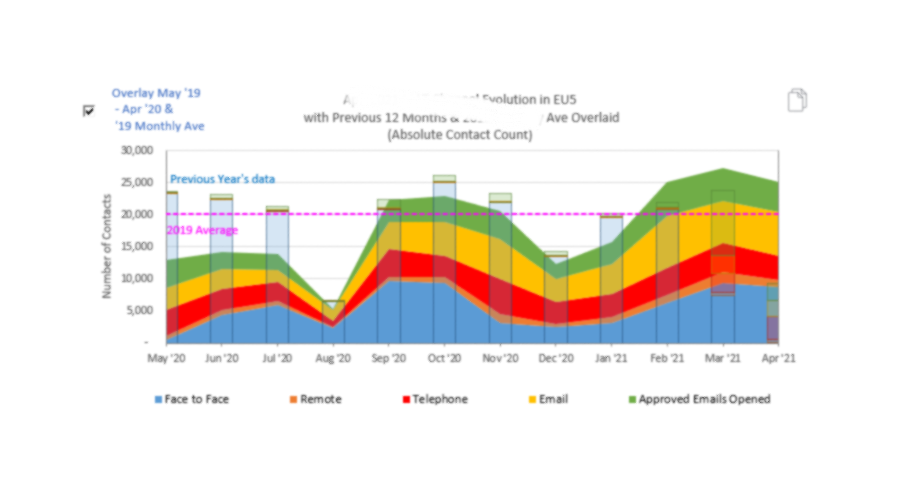
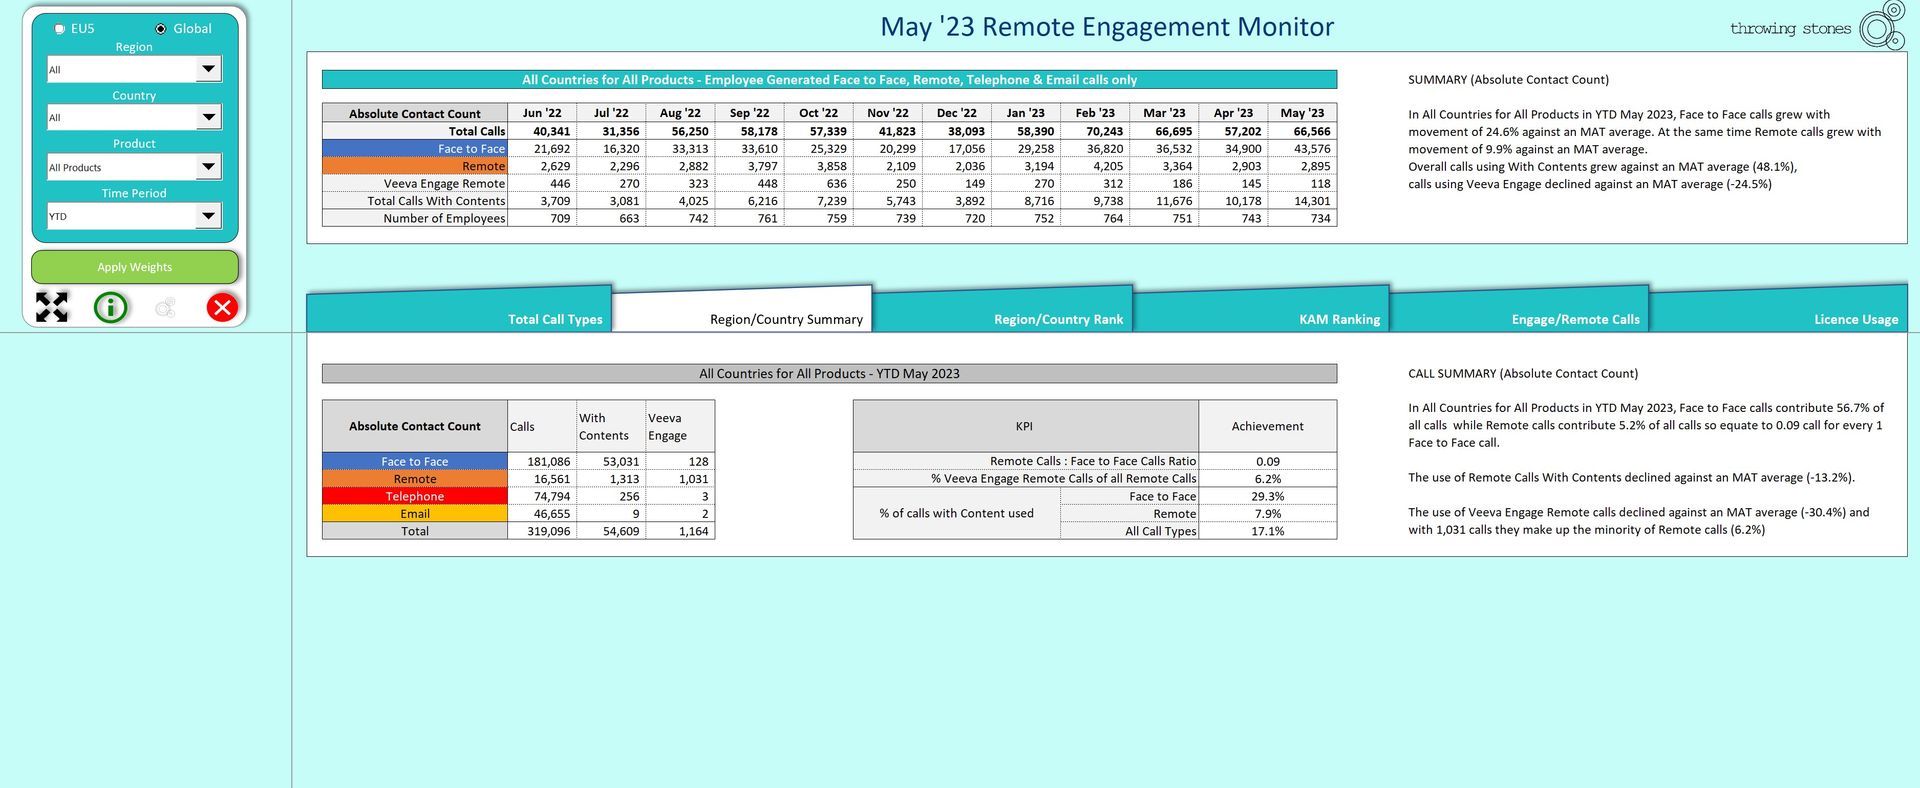
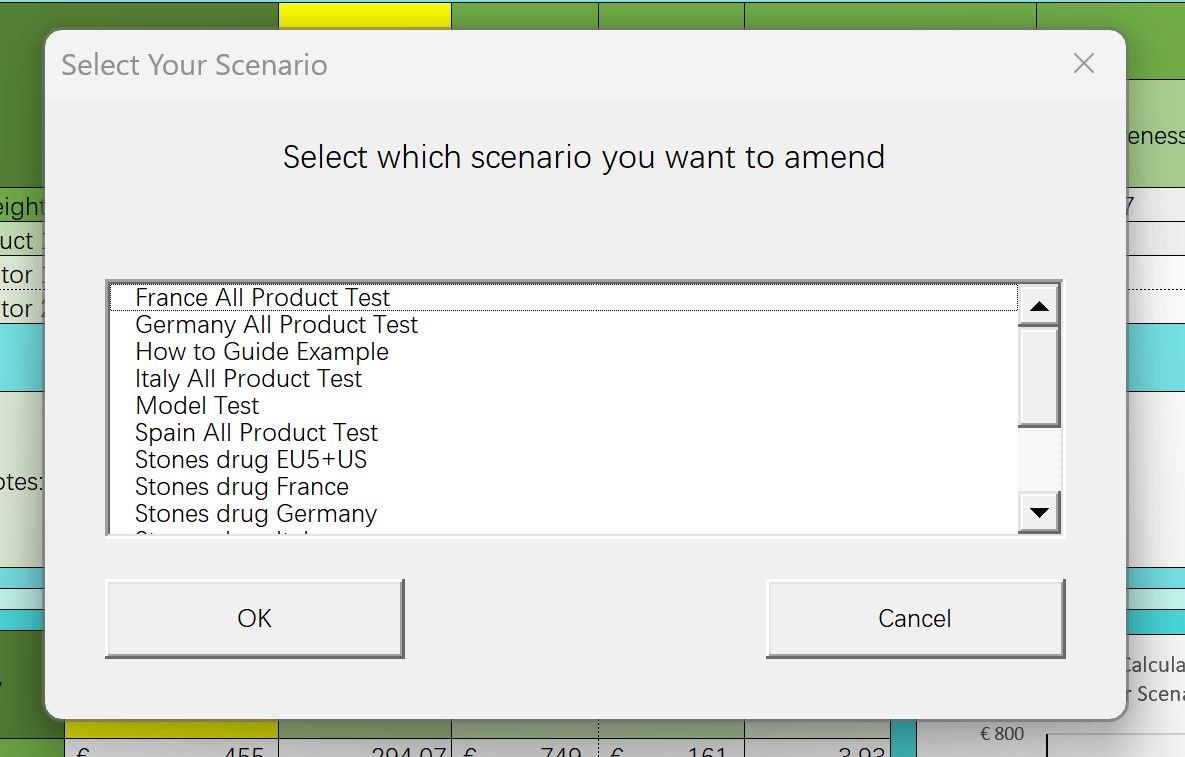
Covid Channel Evolution Model
A Mid-sized Biotech wanted to understand the impact that Covid, and the movement to remote and online interactions with customers, had on their business. They wanted a tool that allowed their channel calls to be viewed by month, by country and by region.
They needed a commentary on the data and analysis that changed according to the selections made and the data pulled
They needed quick comparisons against their 'pre-covid' numbers and be able to view analysis based on their key timeframes - MAT, Cycle and month. This tool automatically updates all analysis every month for instant, up to date analysis
Project 3
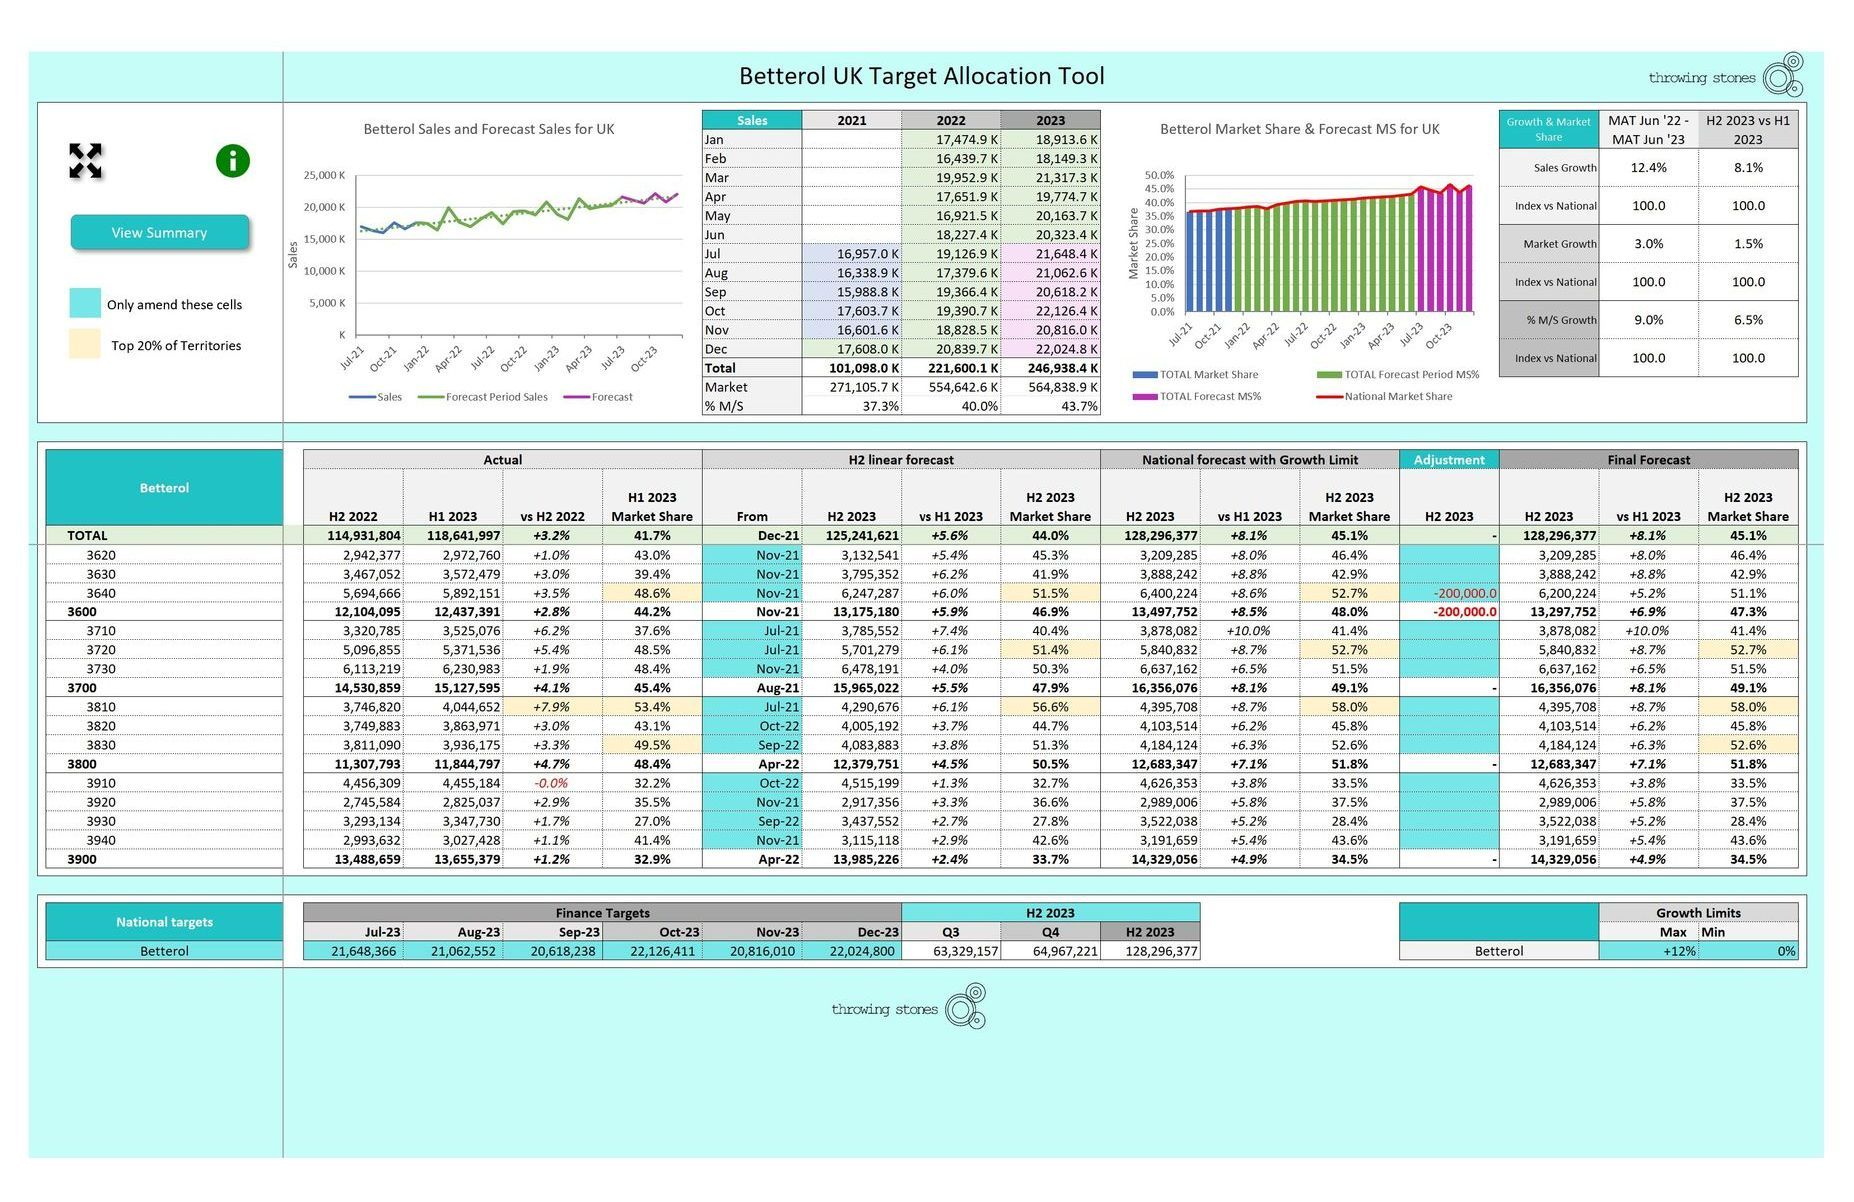
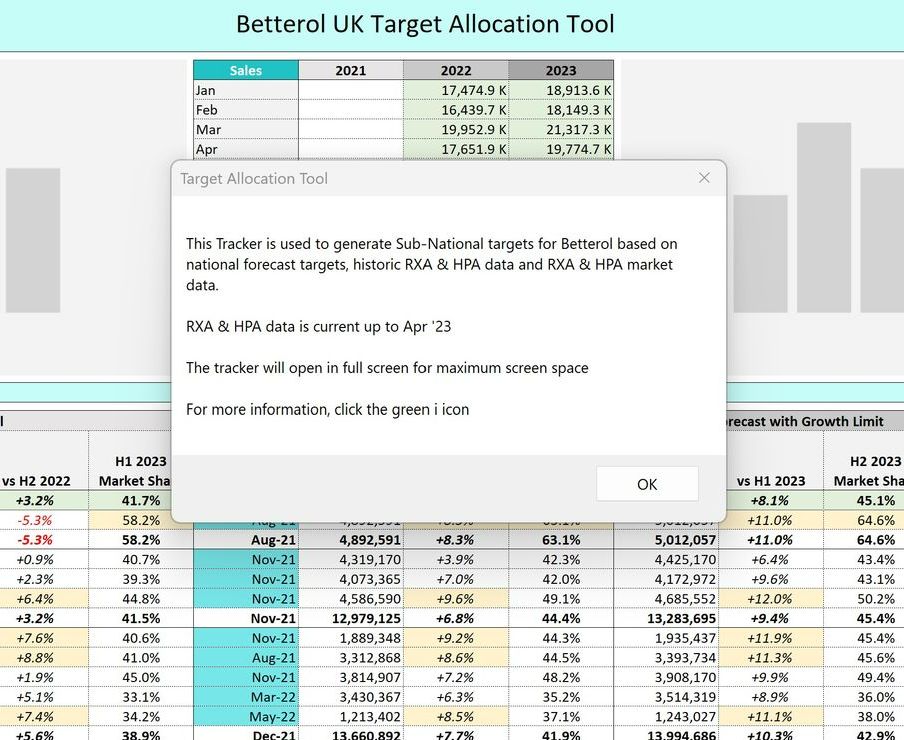
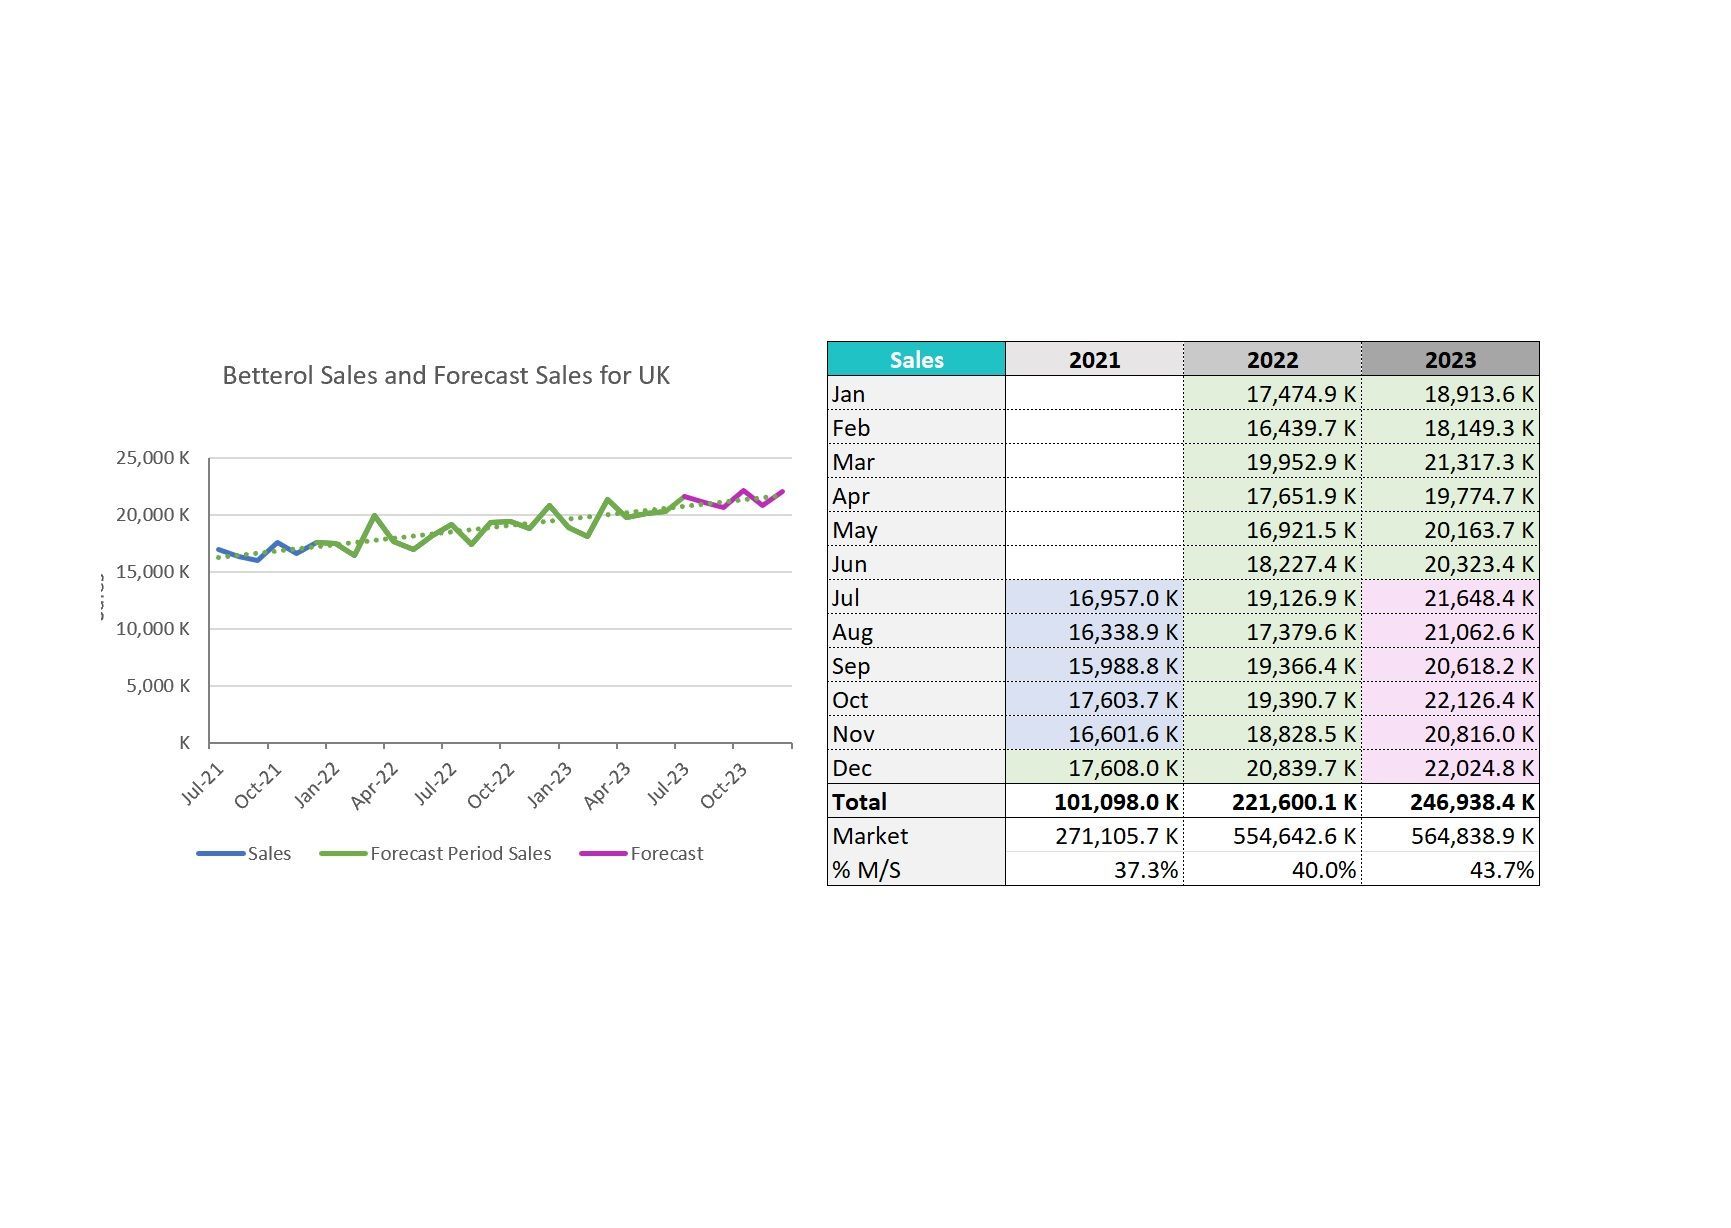
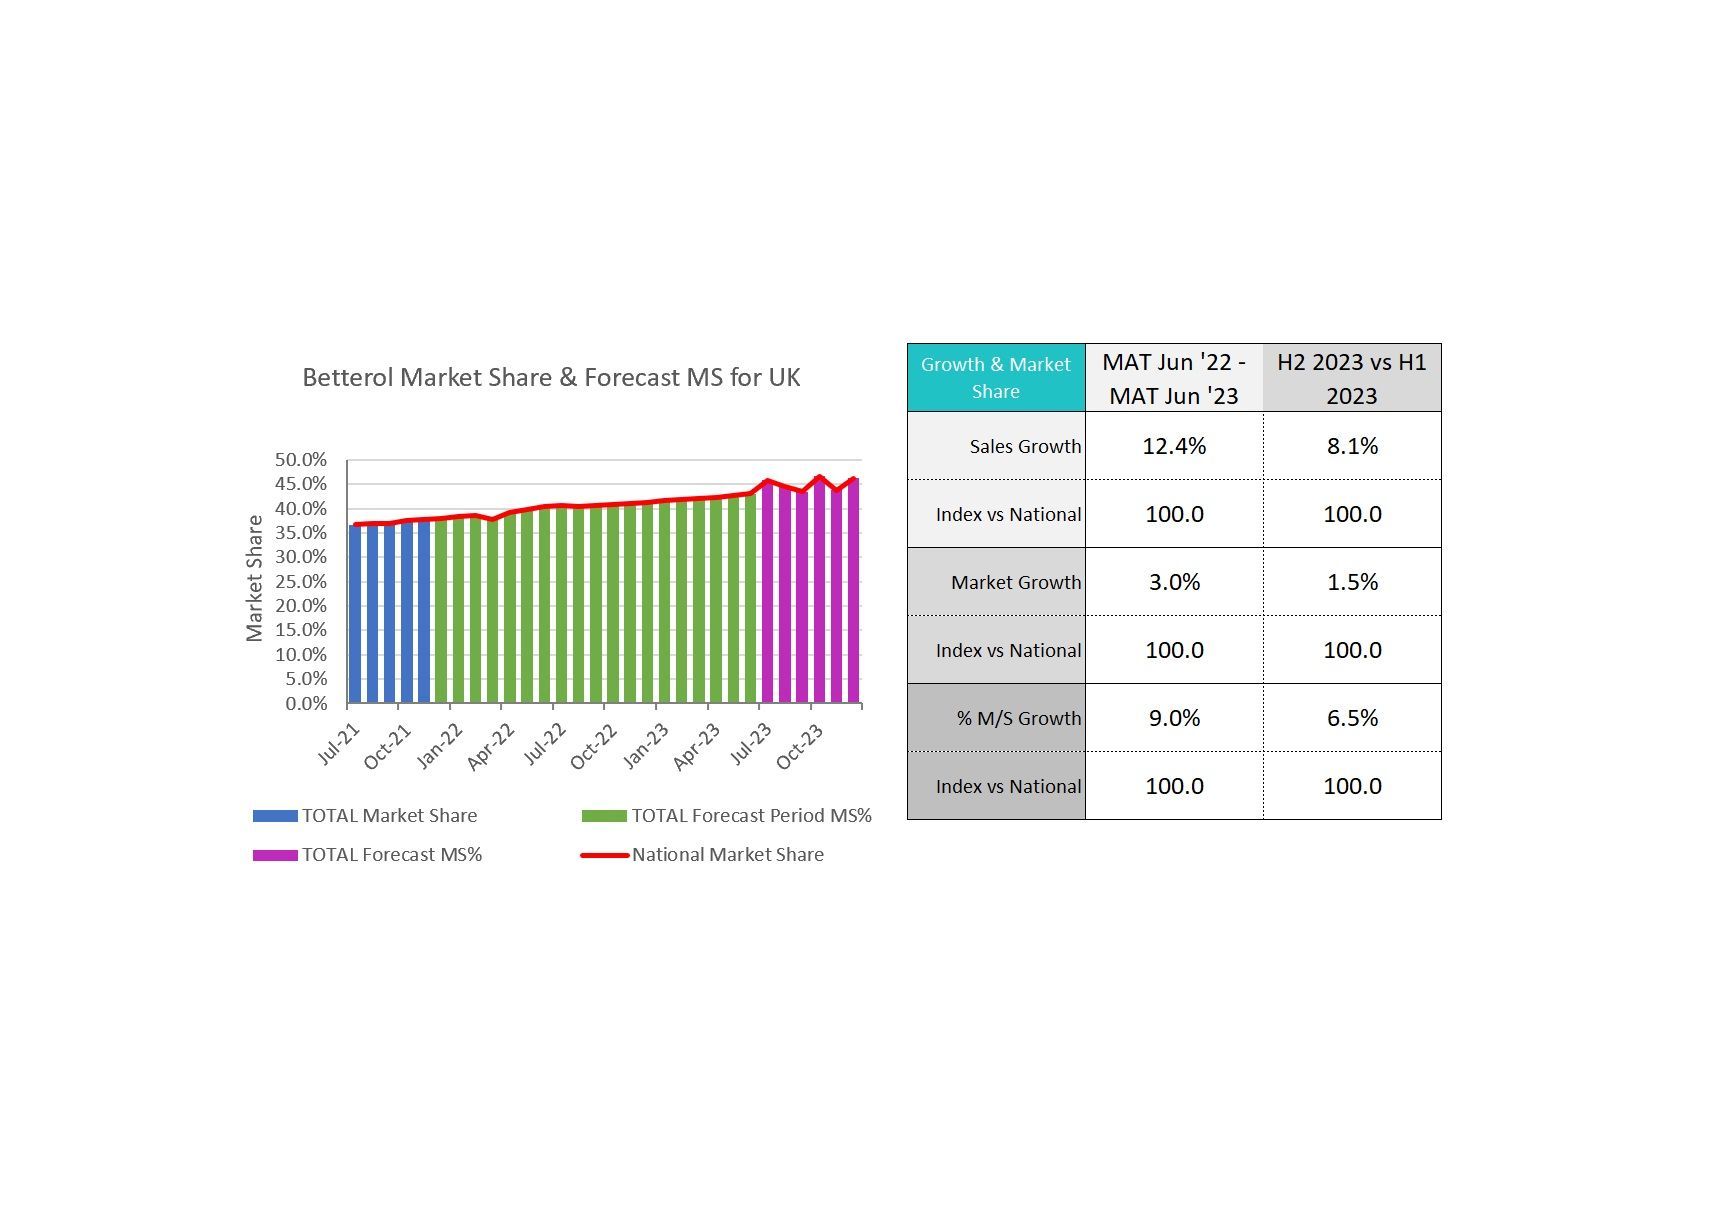
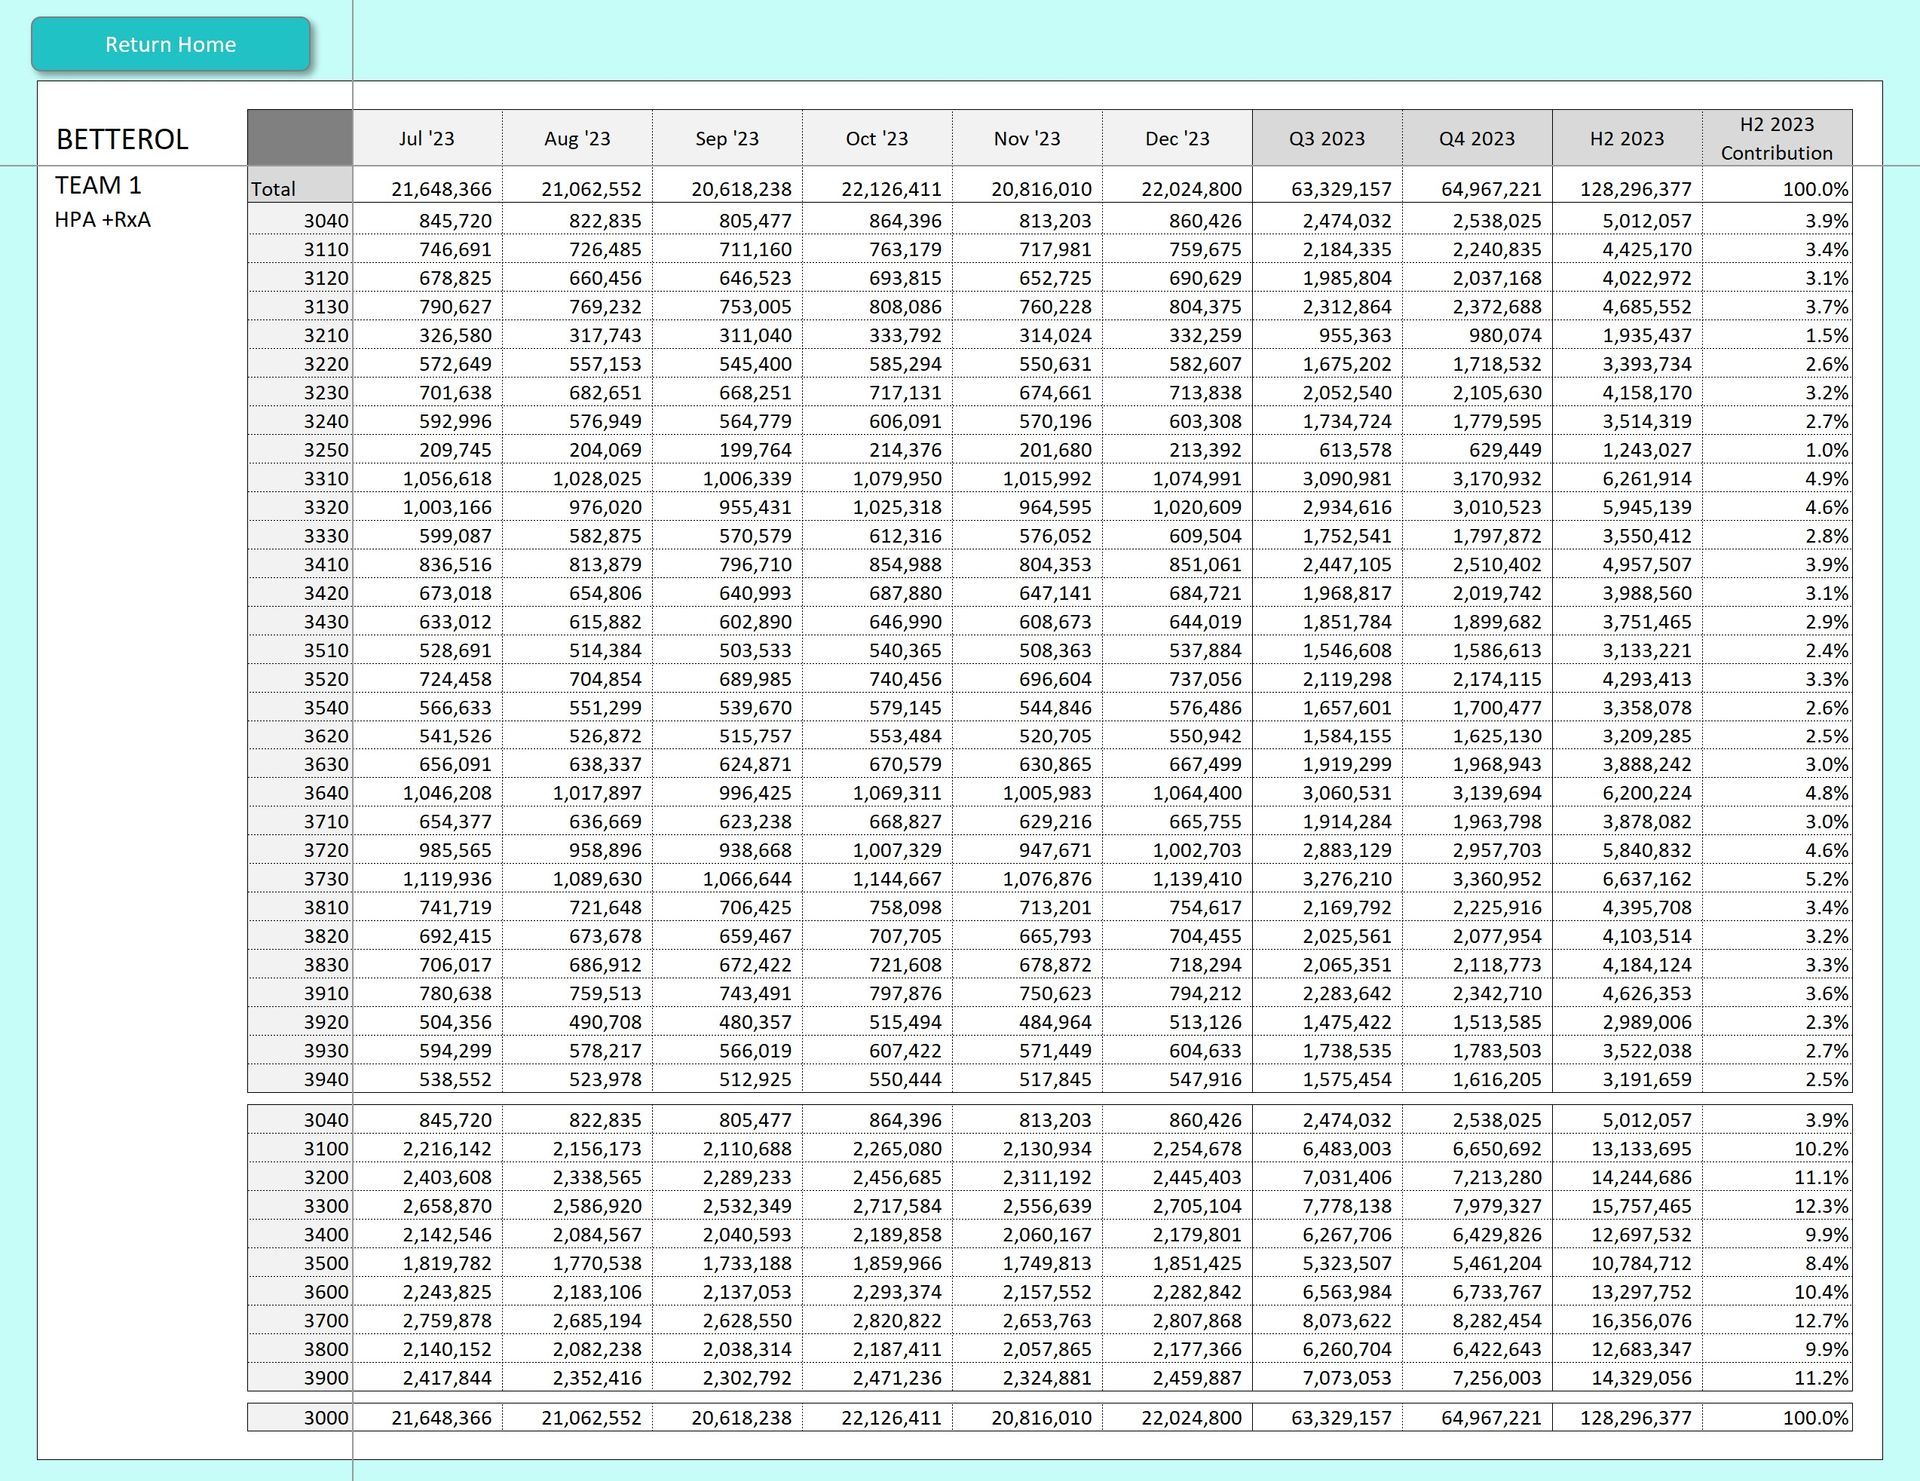
Sub-National Target Setting
A Top Tier Biotech company wanted to move away from 'Black Box' target setting for their field-force. Our brief was to create a system and process that would be transparent, easy to understand and would increase the level of buy-in and ownership of the targets by the field-force. We created a tool that used historic sales and market shares to predict future sales but also allowed for growth rates to be set and limited and allowed instant manual adjustments to cater for territory specific issues than no algorithm can predict. The tool gave visual presentation and became the centrepiece of an interactive target setting session
Project 4
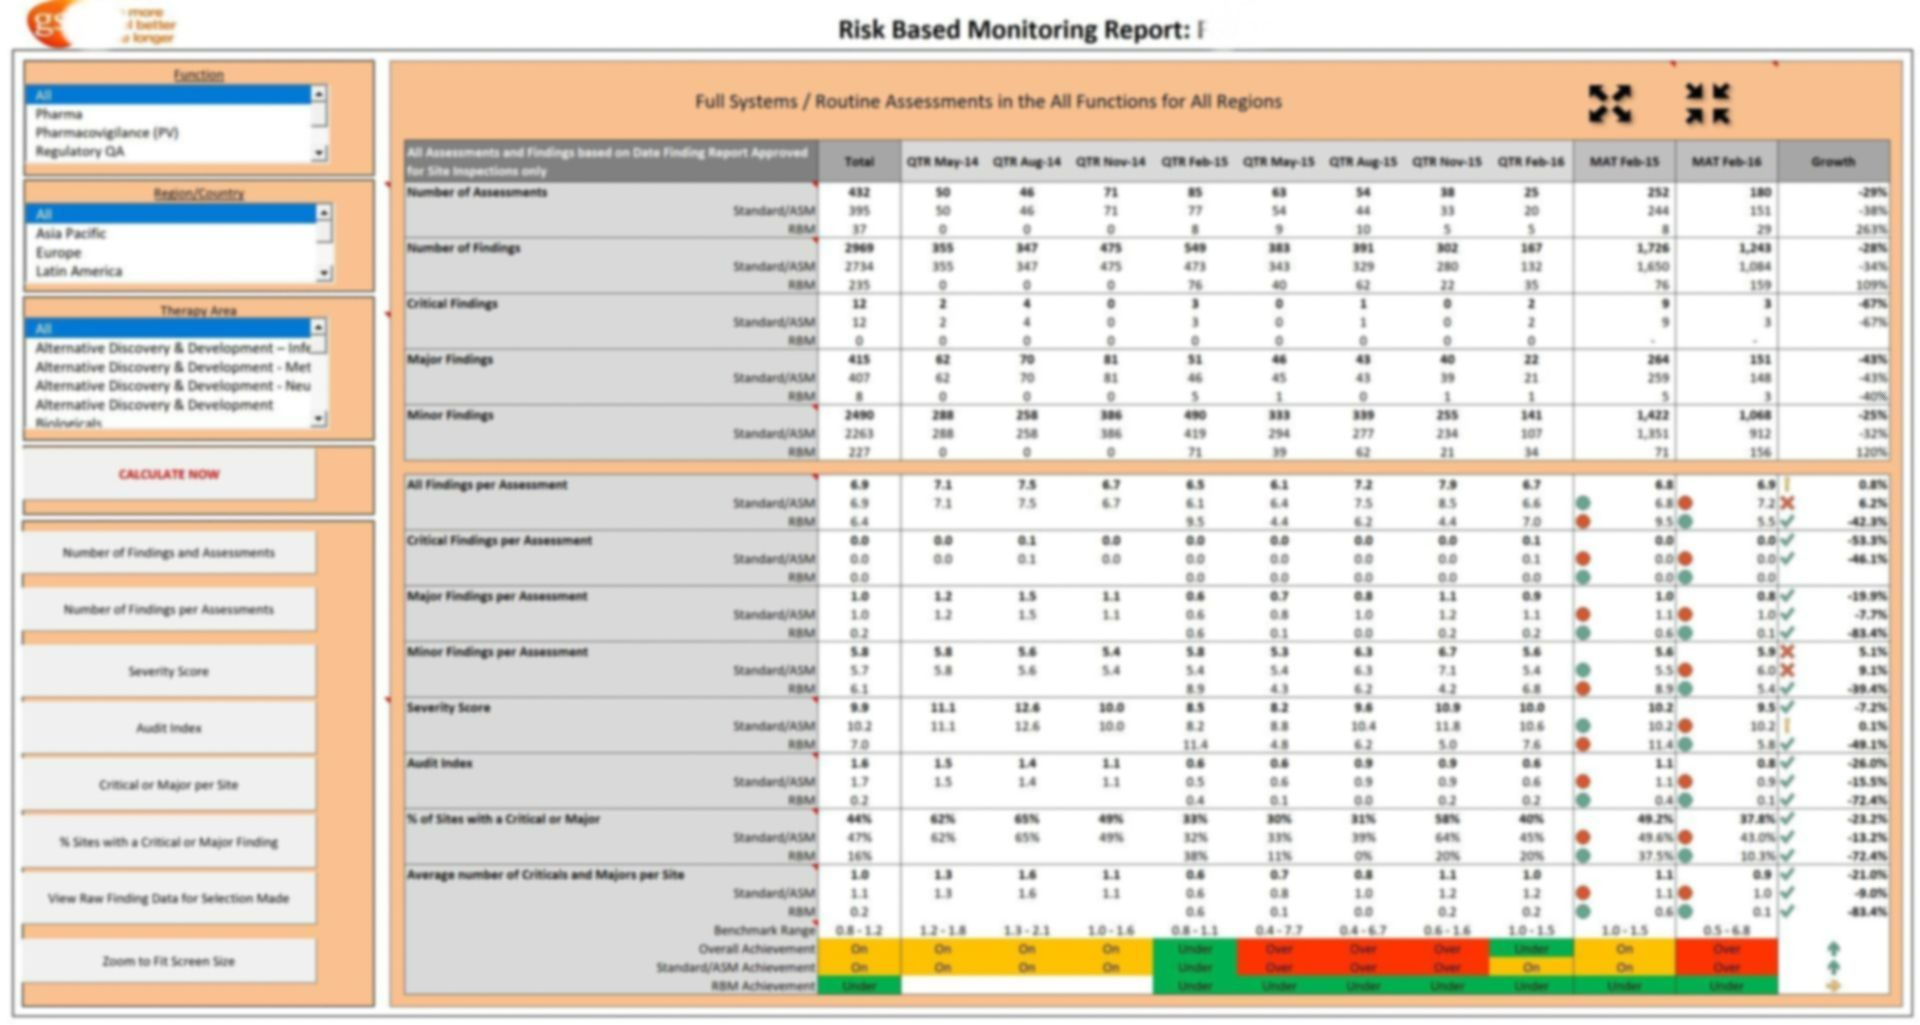
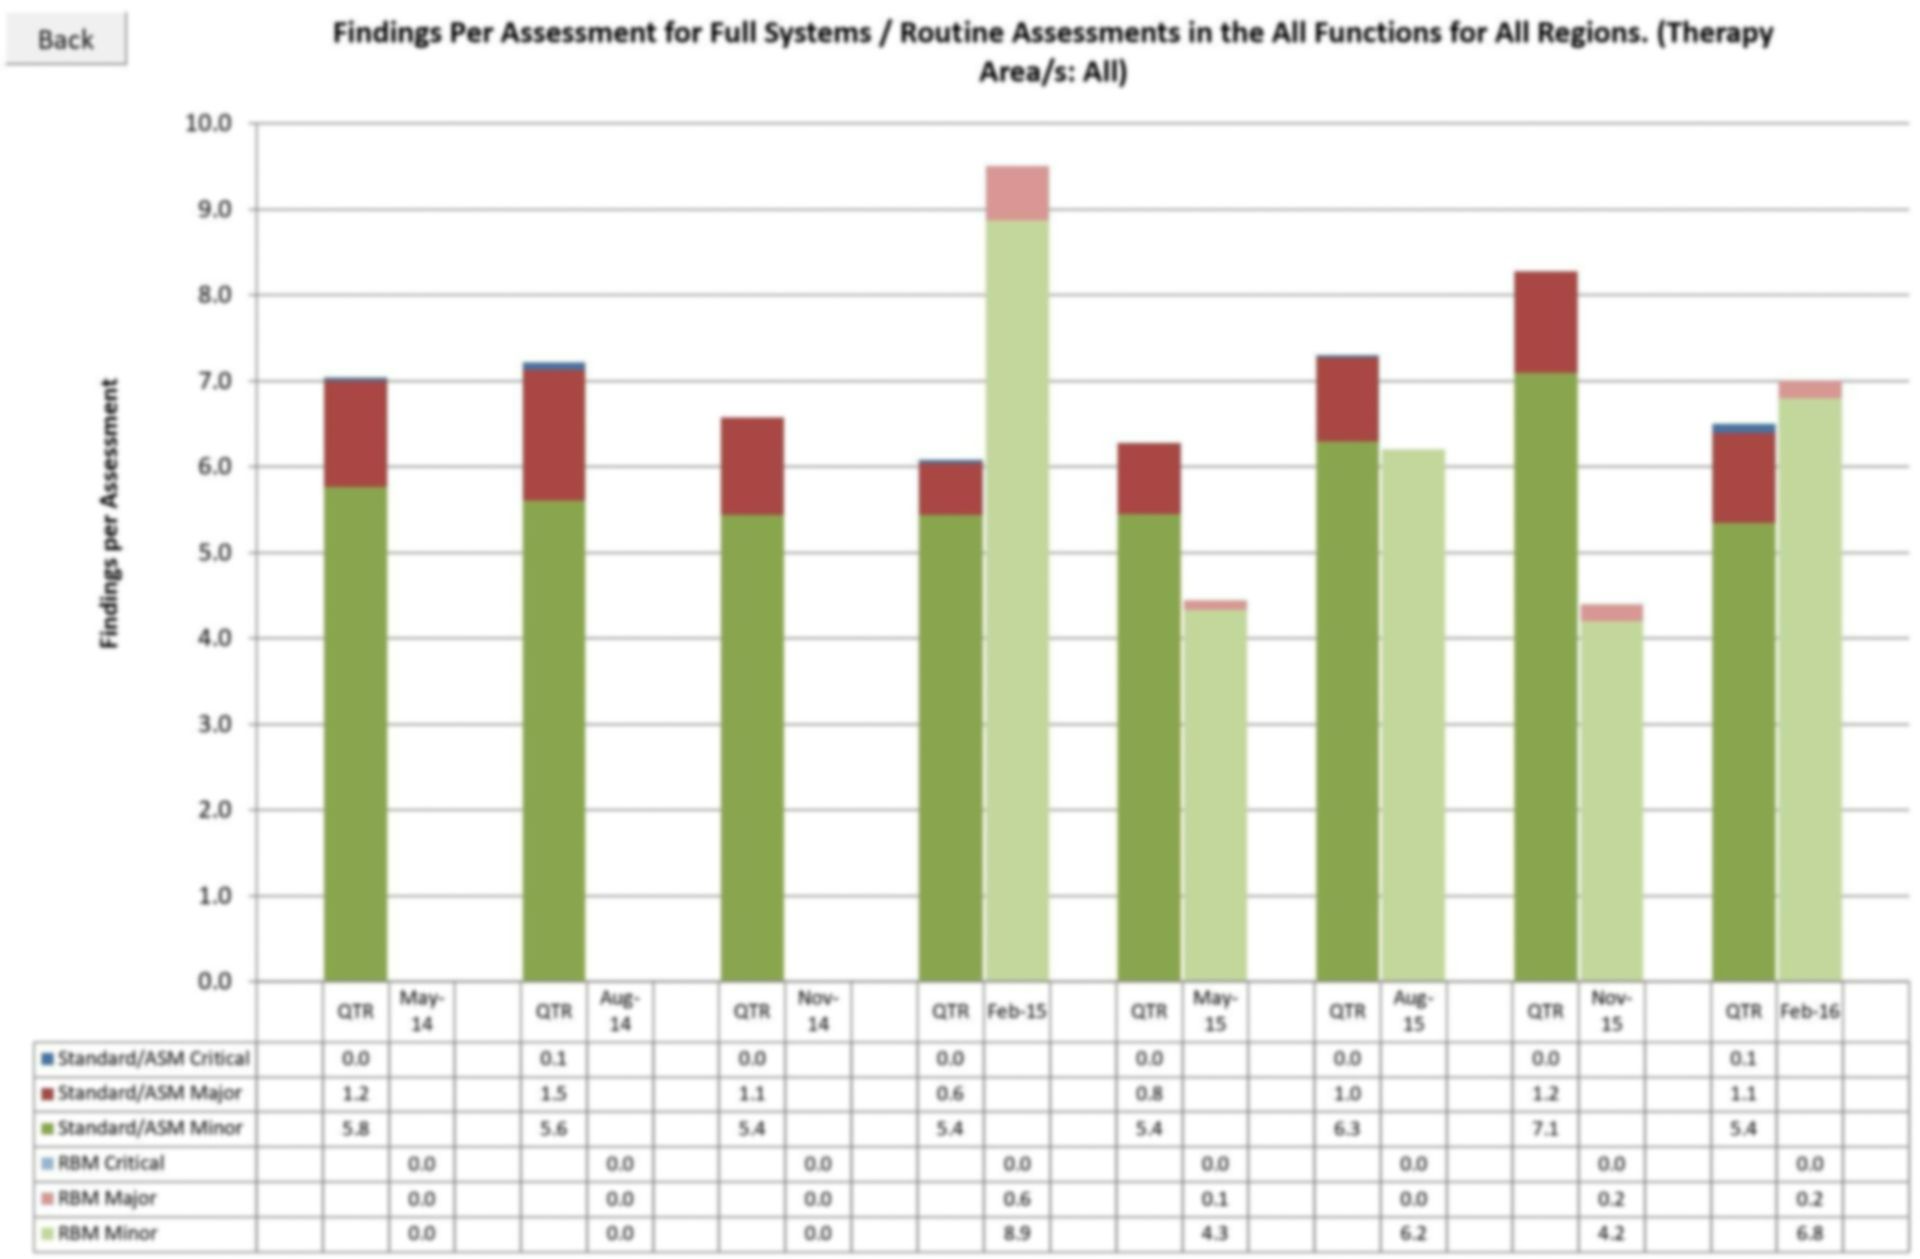
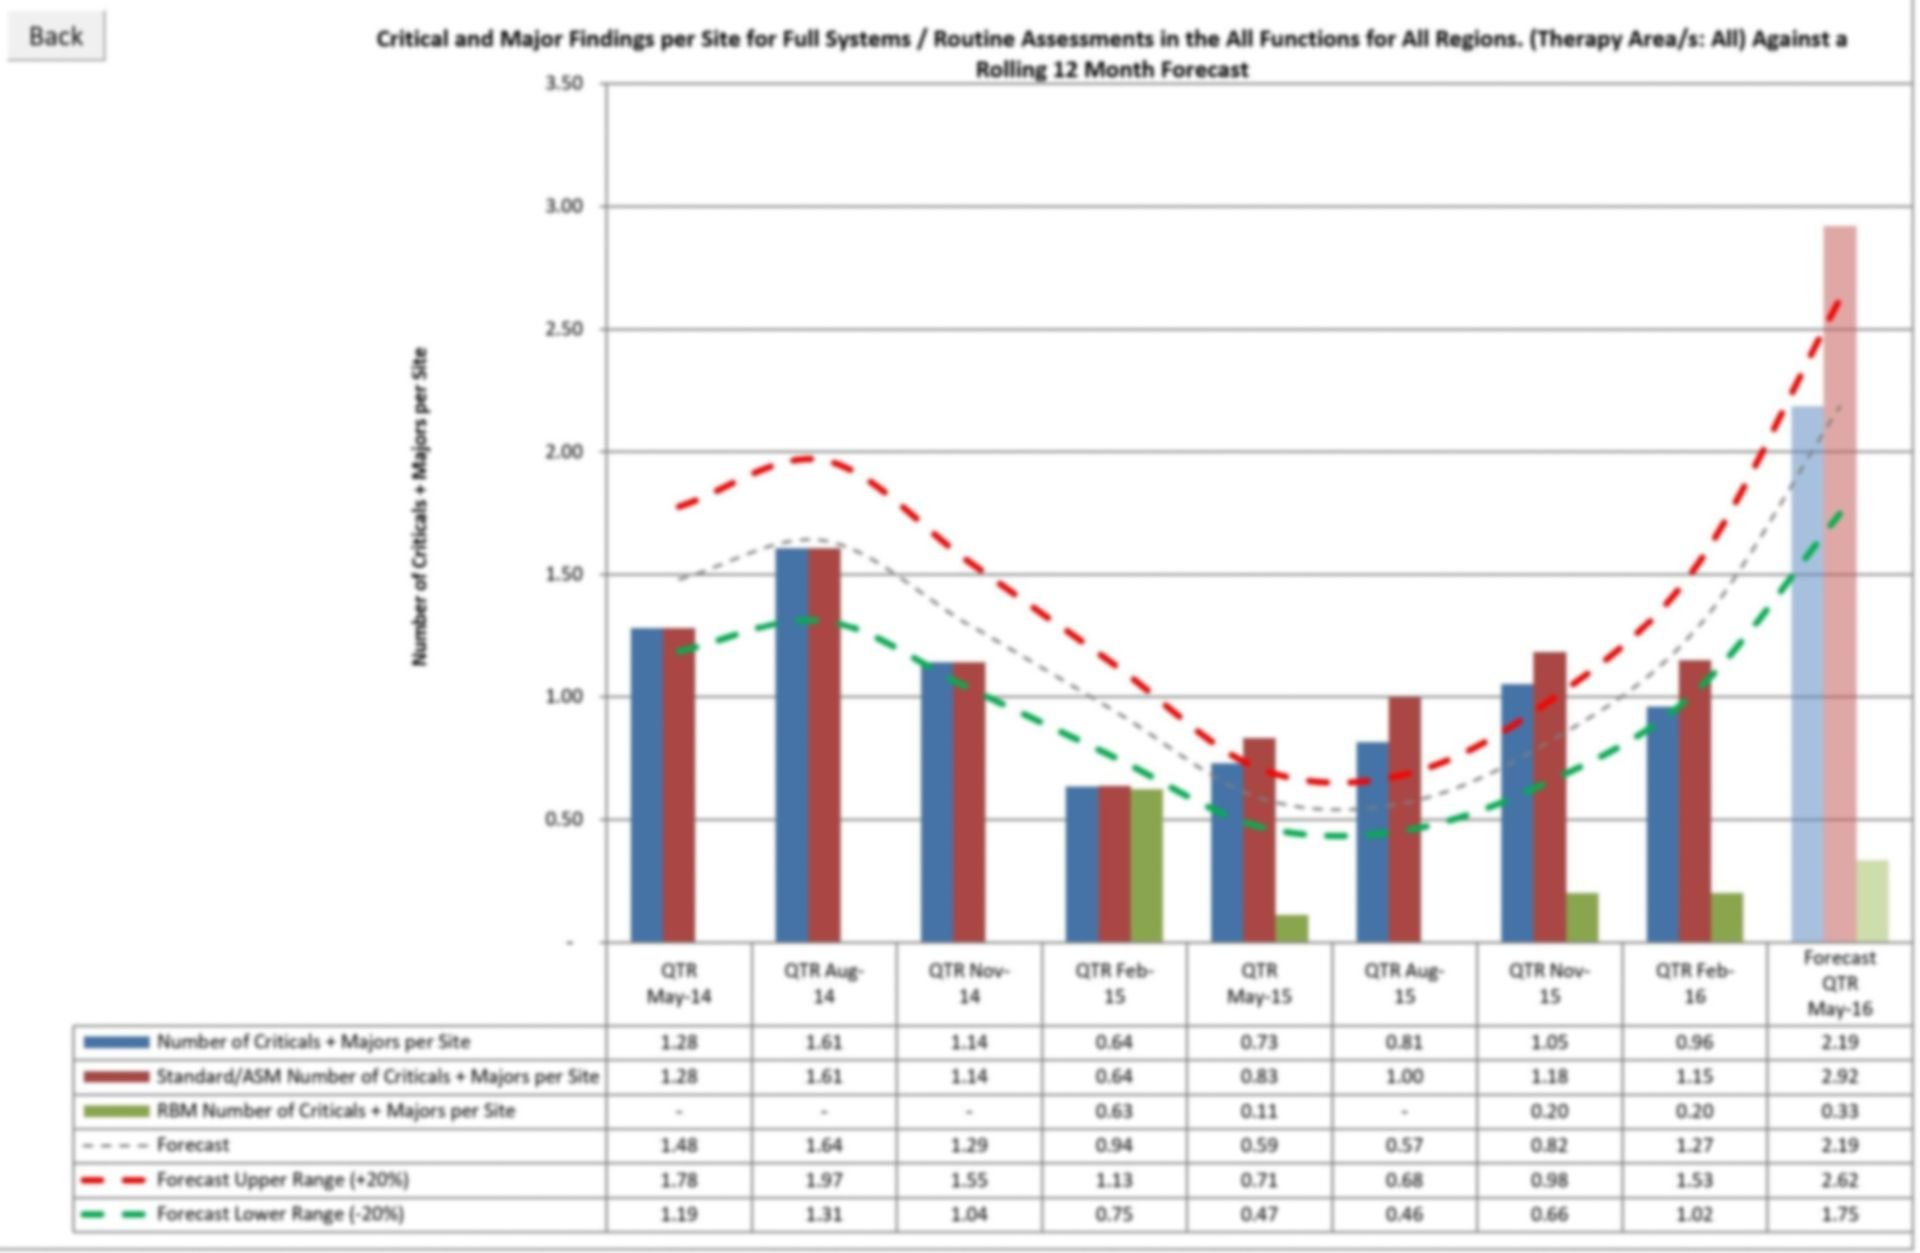
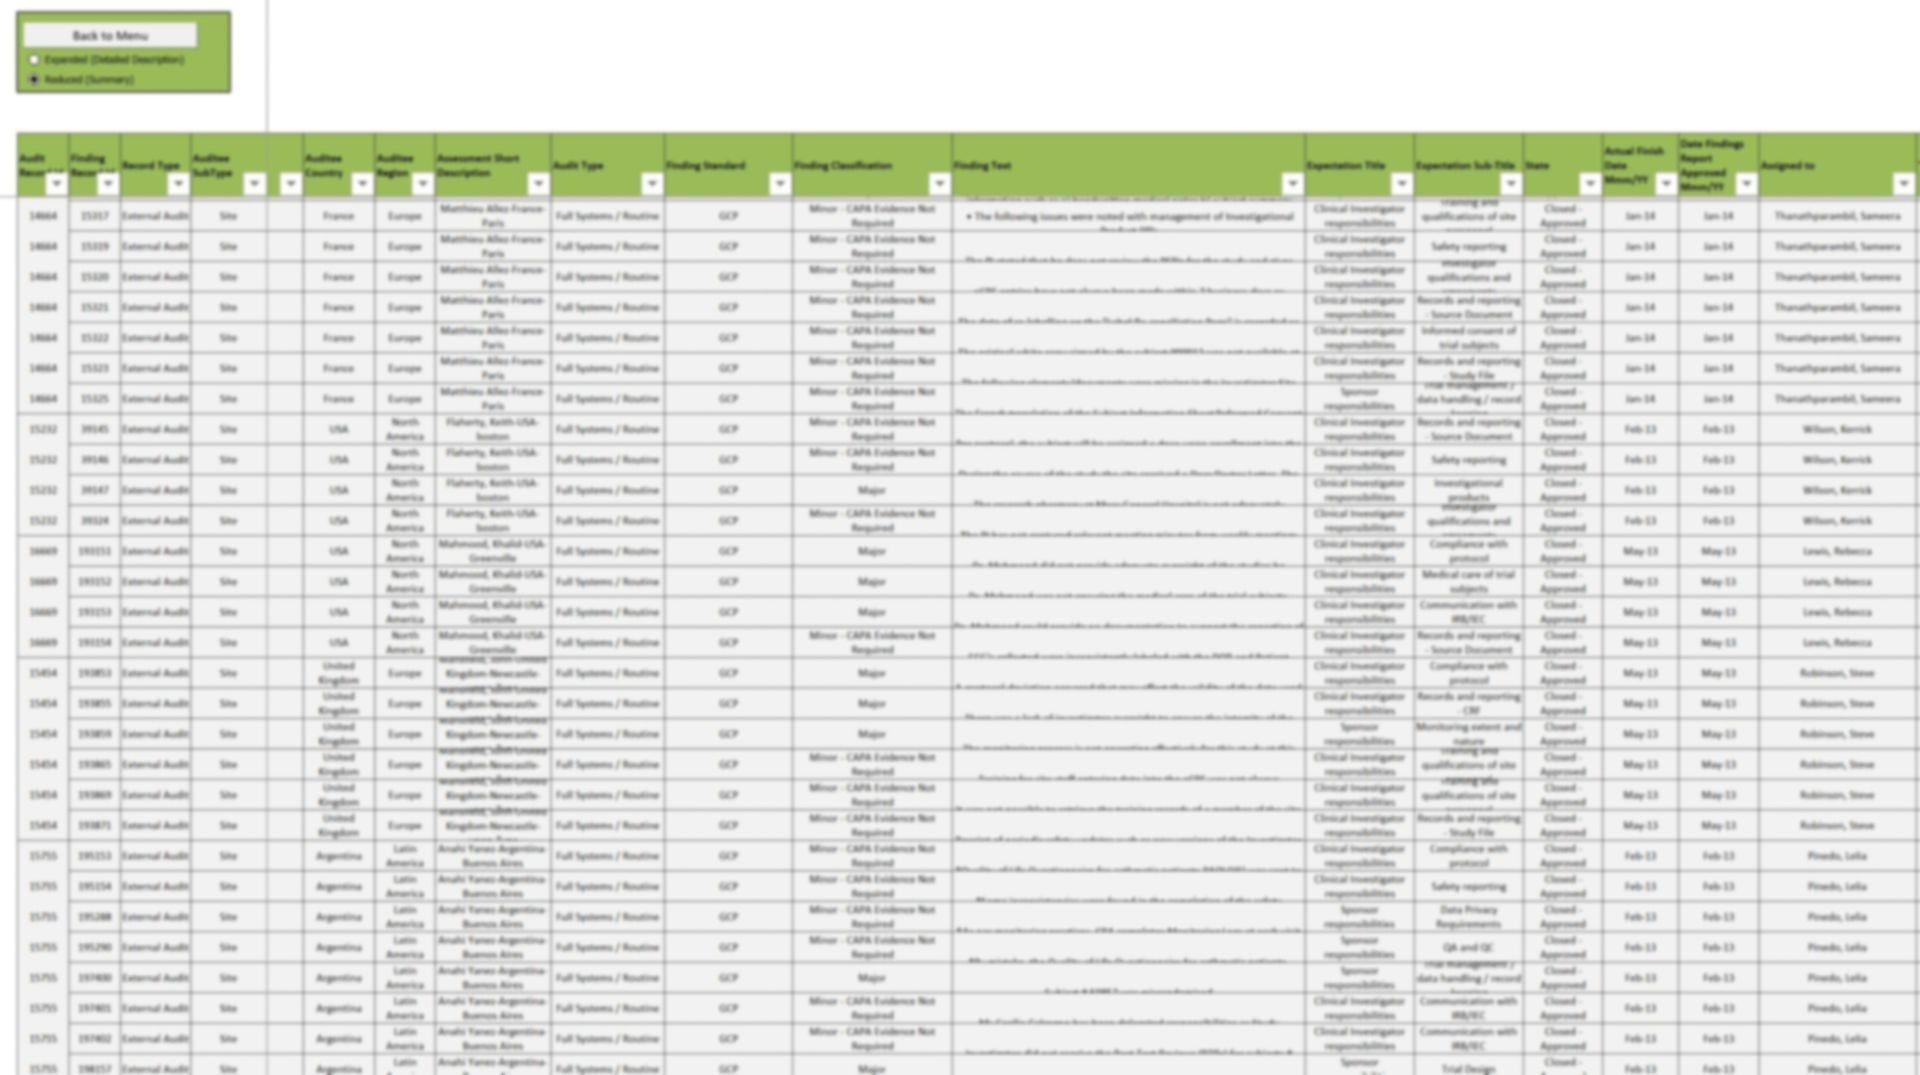
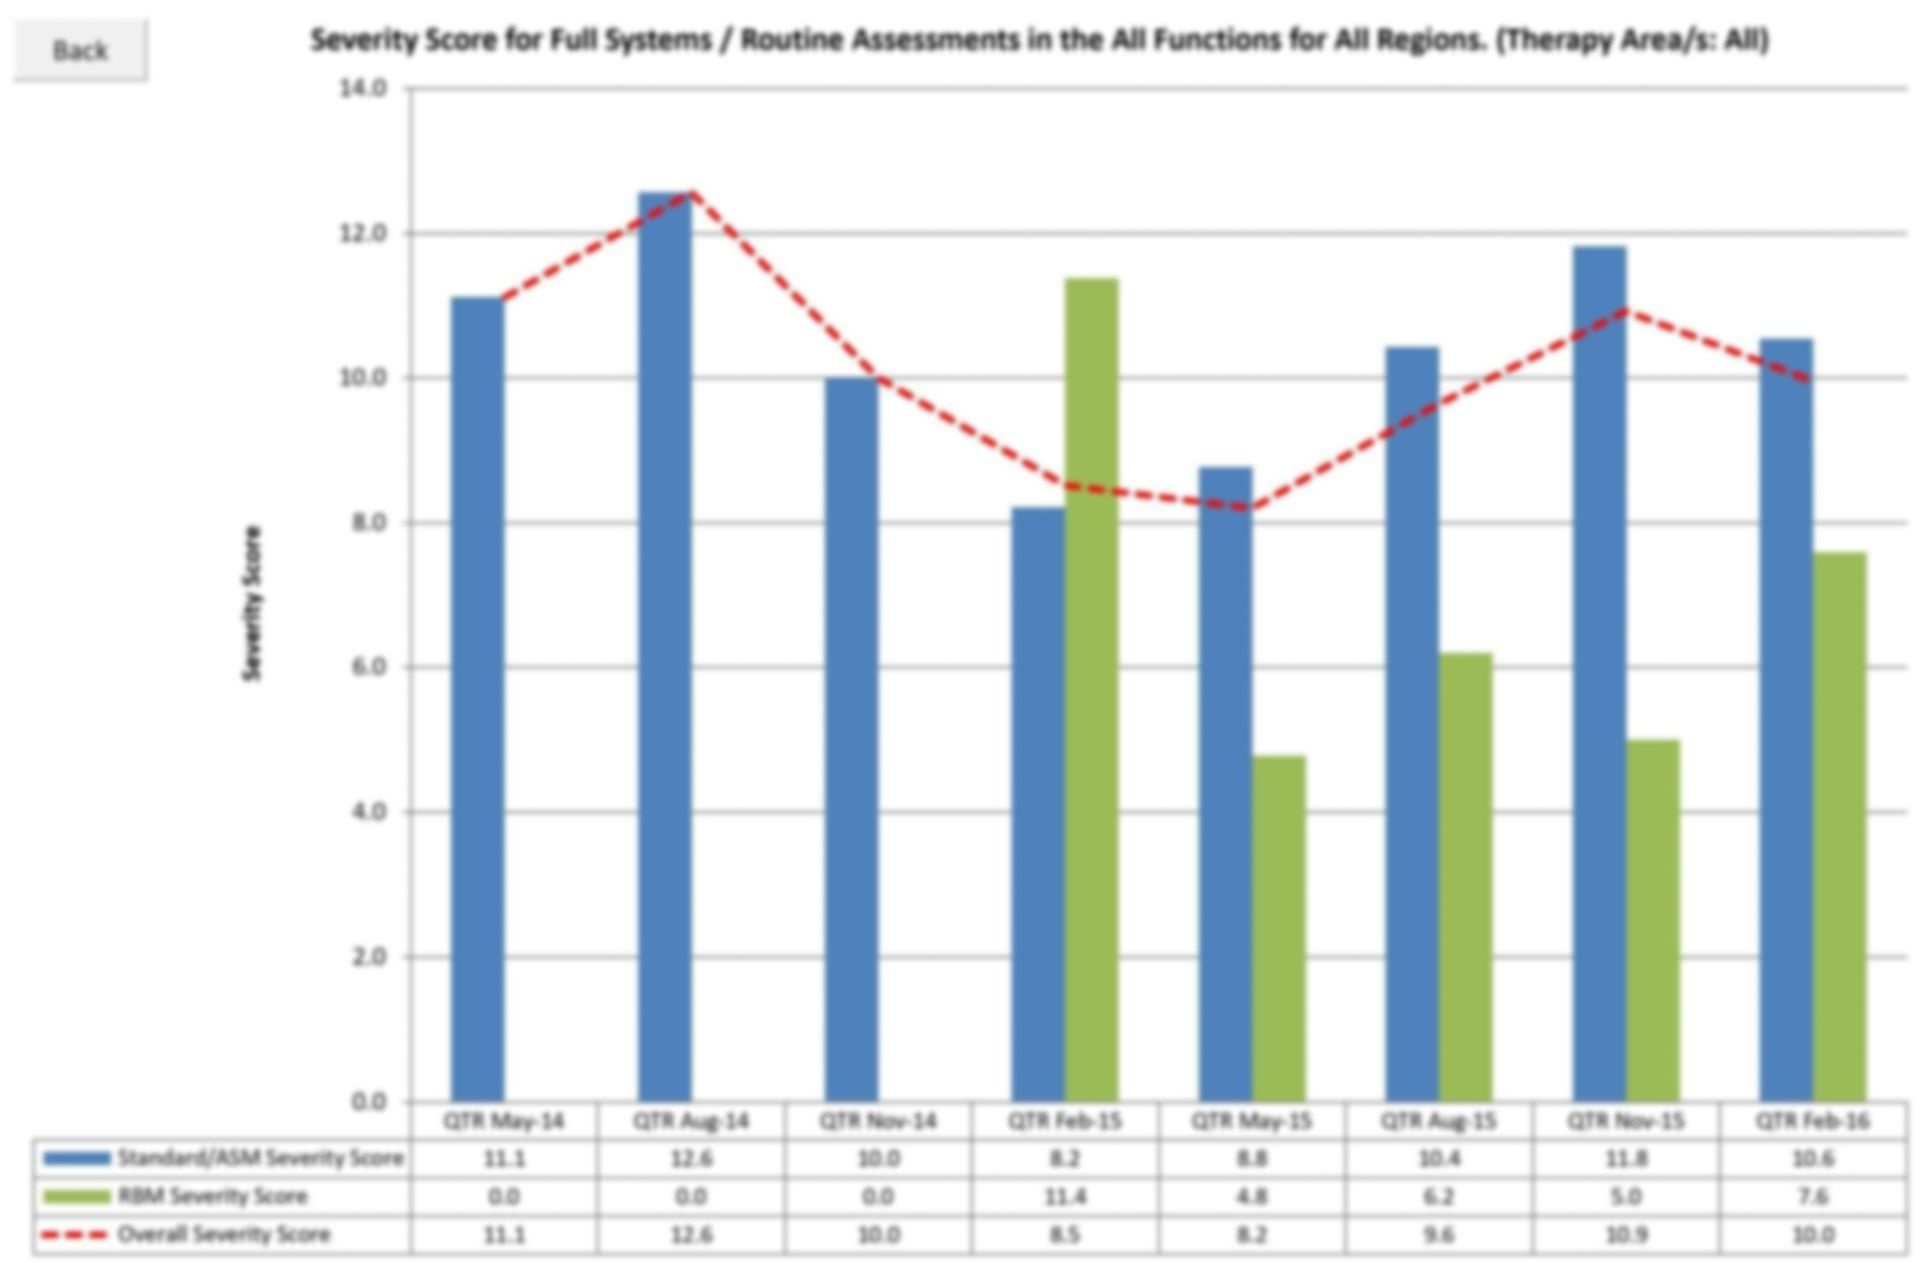
Risk Based Monitoring
The Clinical Trials Auditing dept of a Top 5 Pharma company wanted a dynamic way to view their audit findings to help them visualise any trends and to identify issues, predict fraud and to place the correct trial in the right site. Drawing data directly from an internal warehouse this bespoke excel tool allowed all members of the dept to view the data instantly and in real time
Project 5
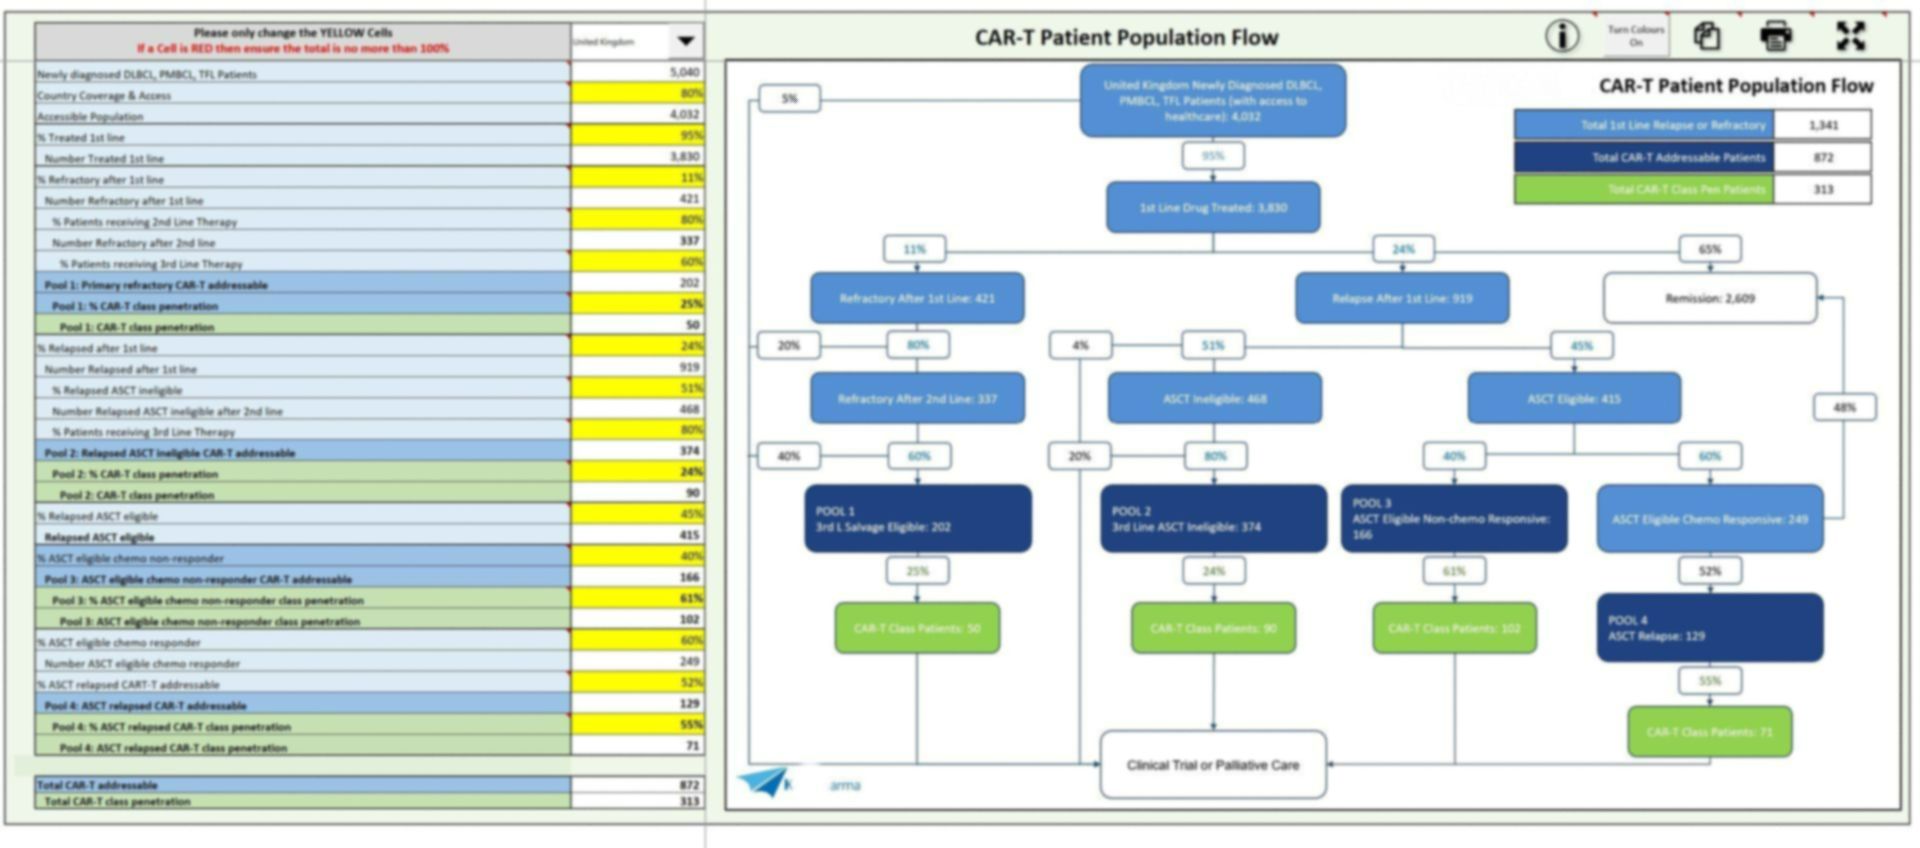
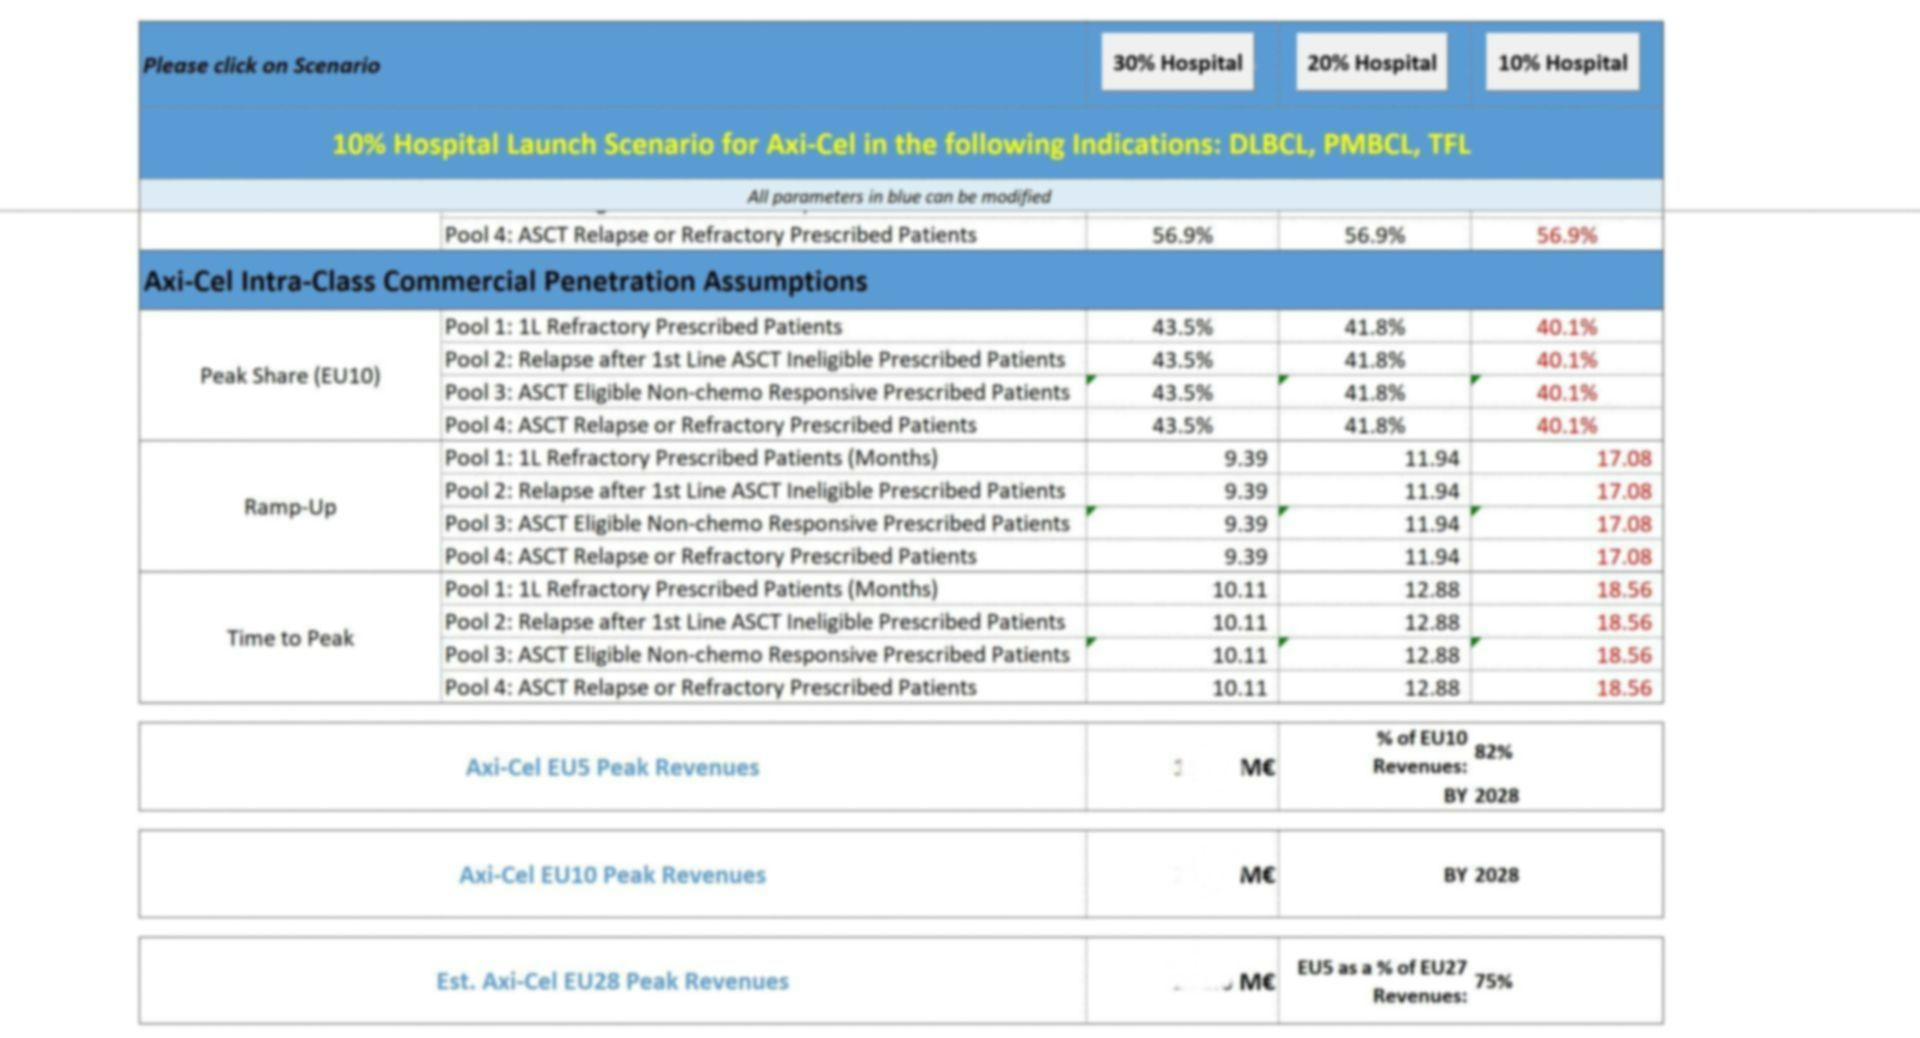
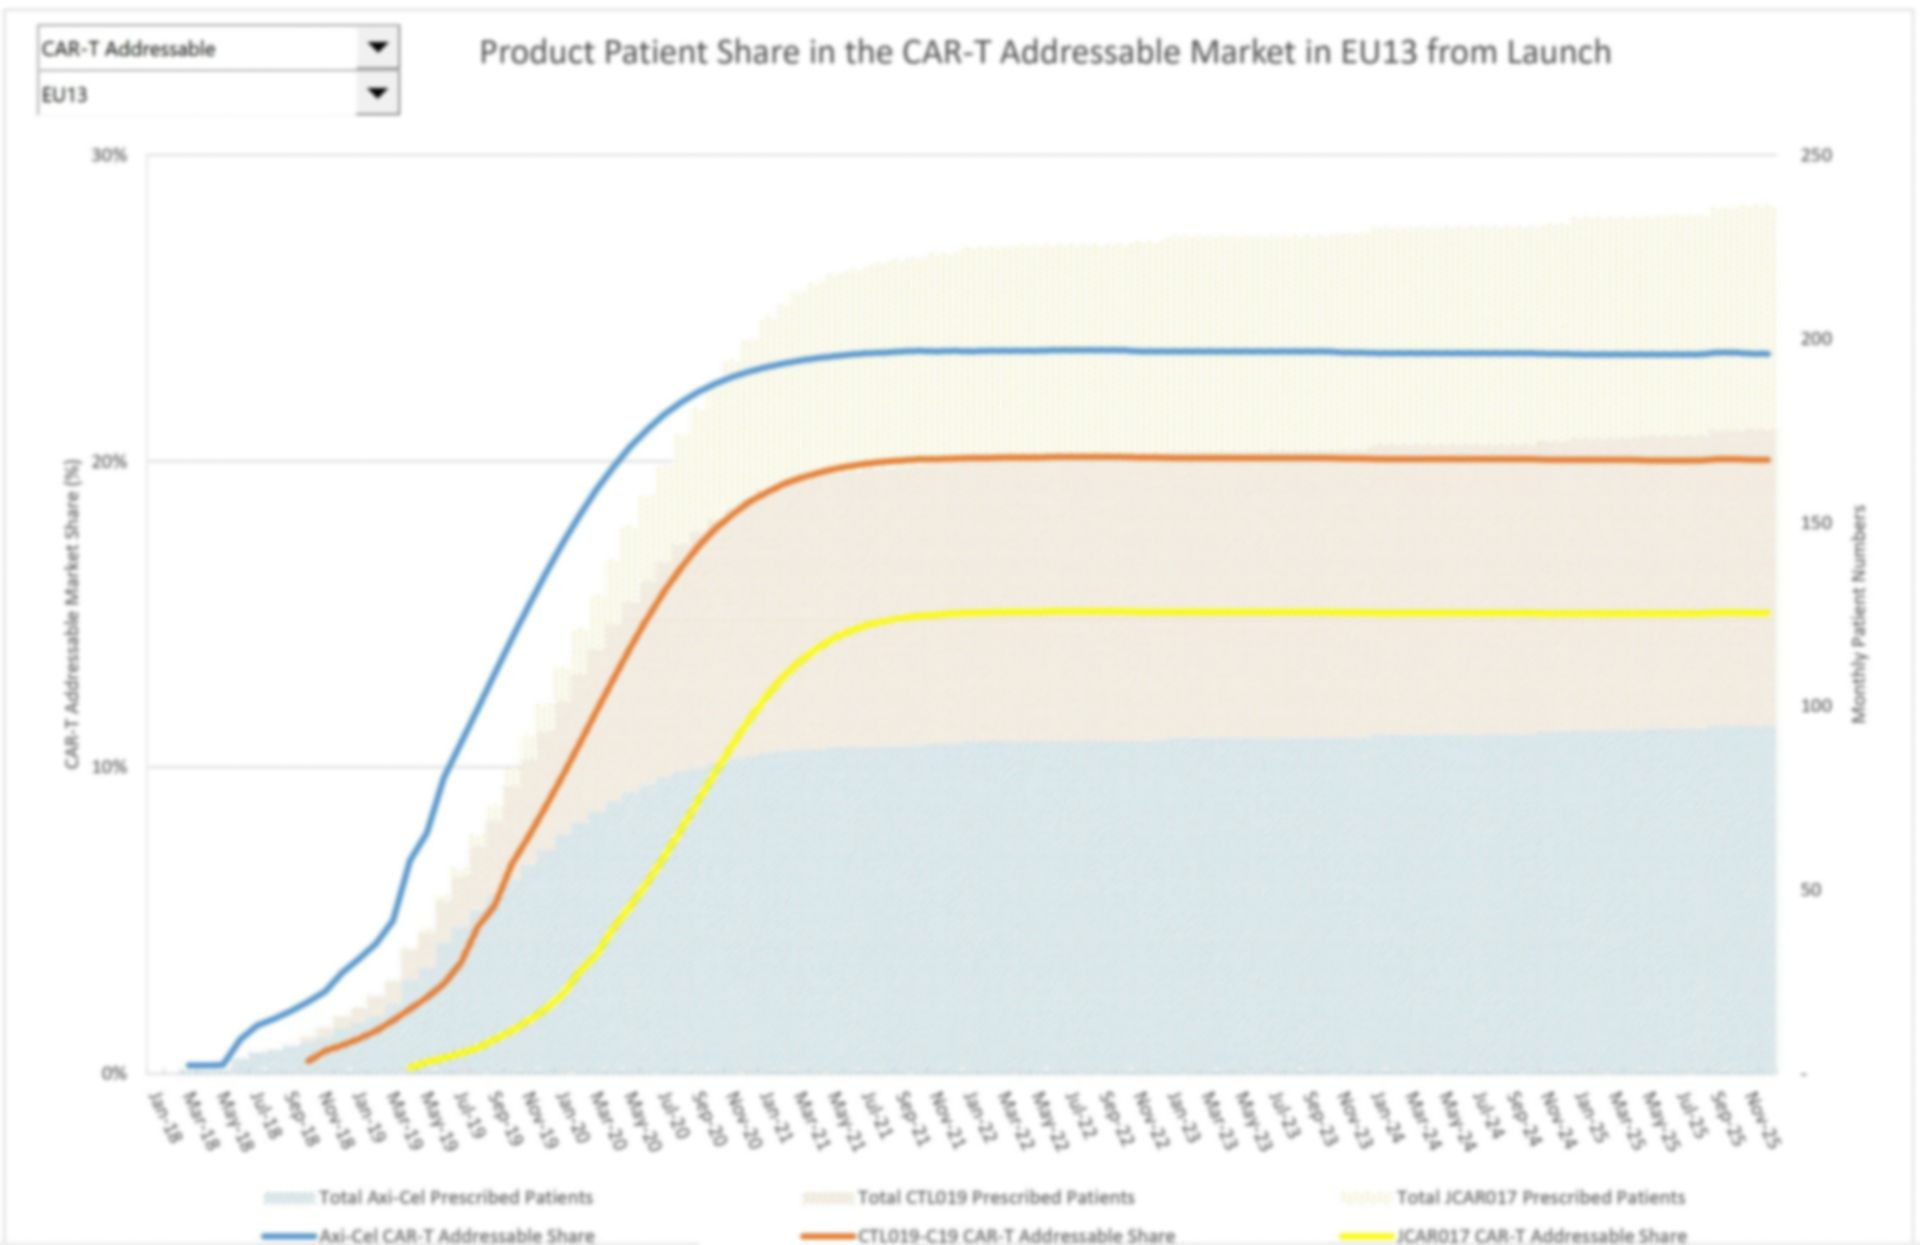
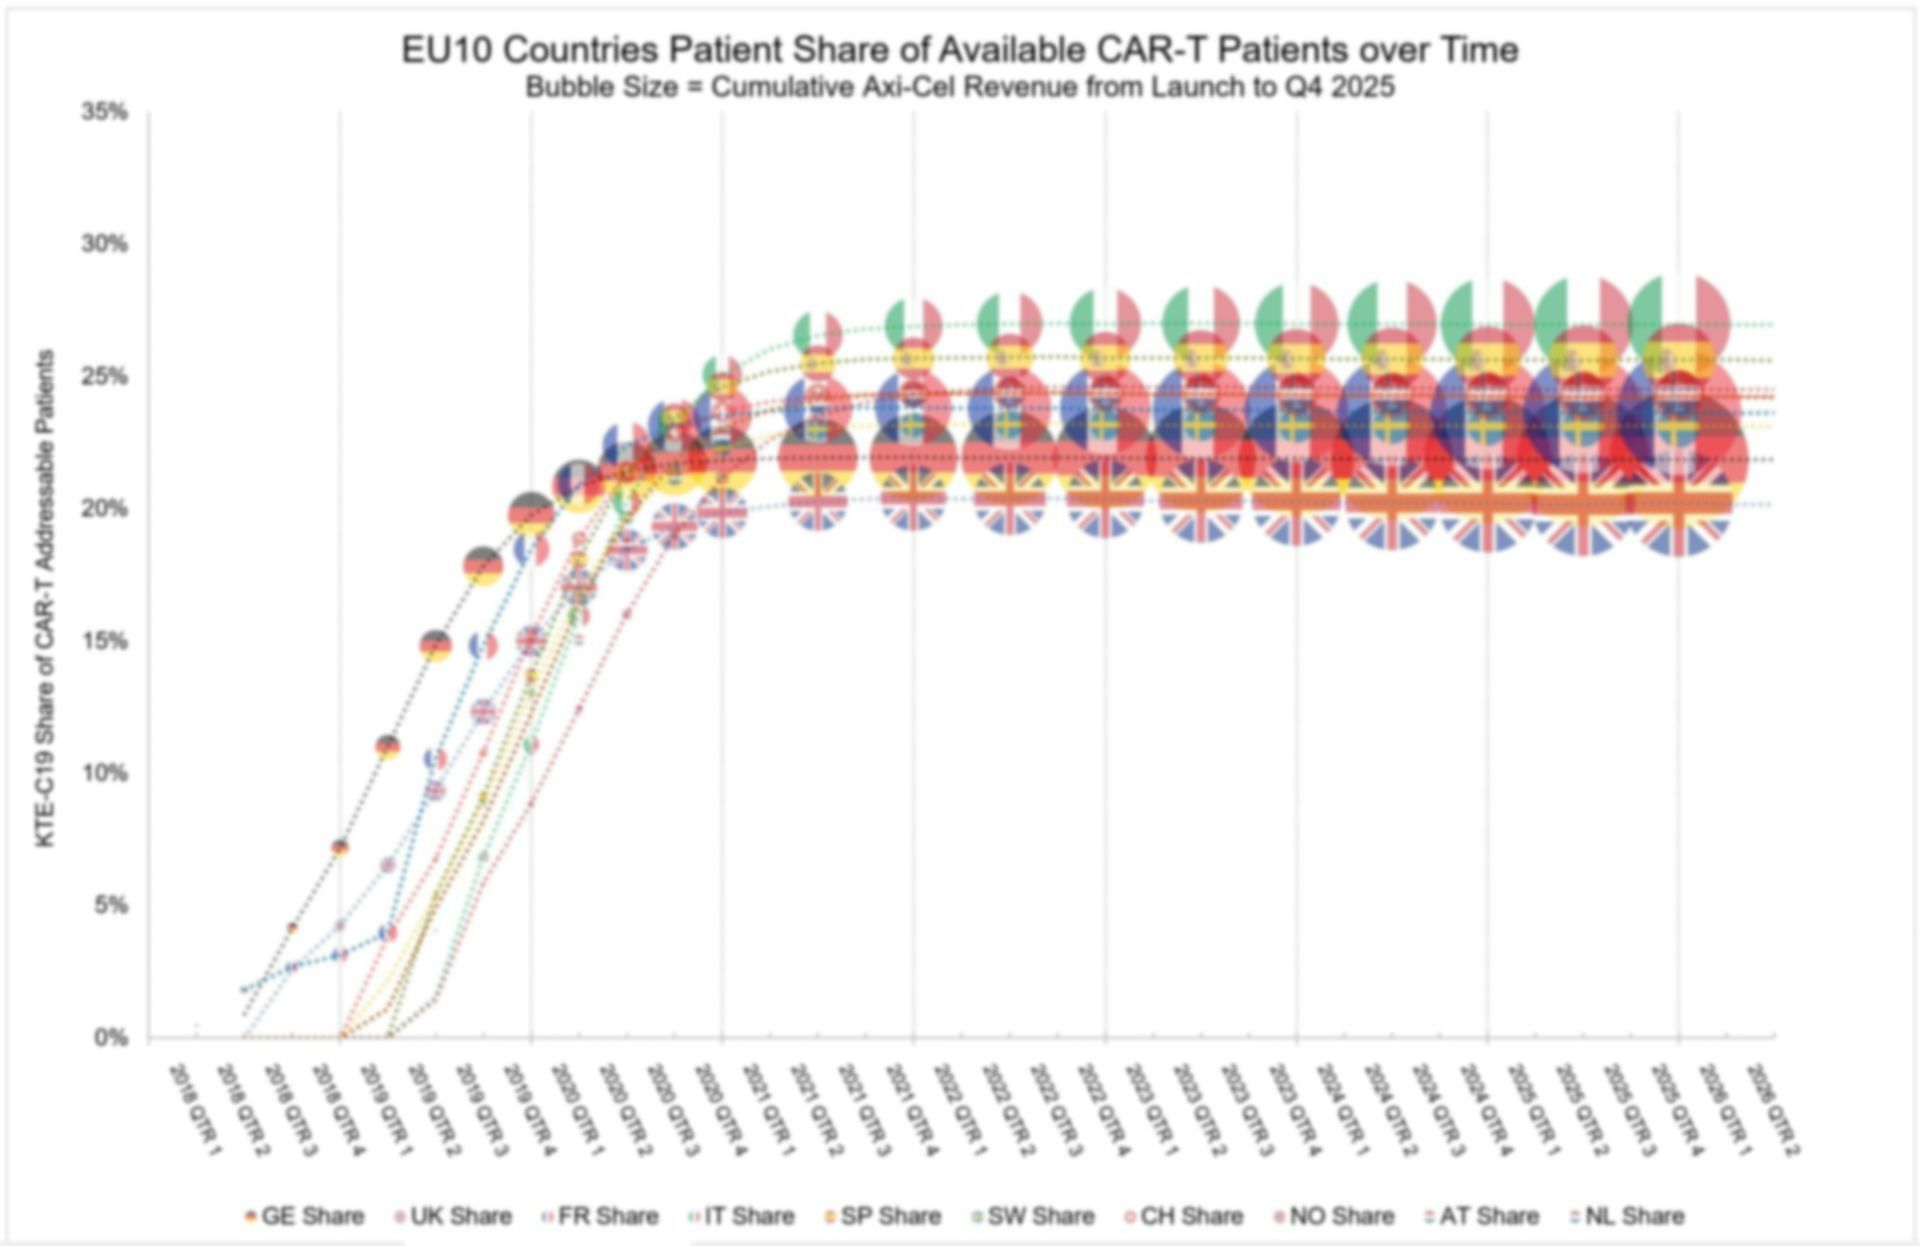
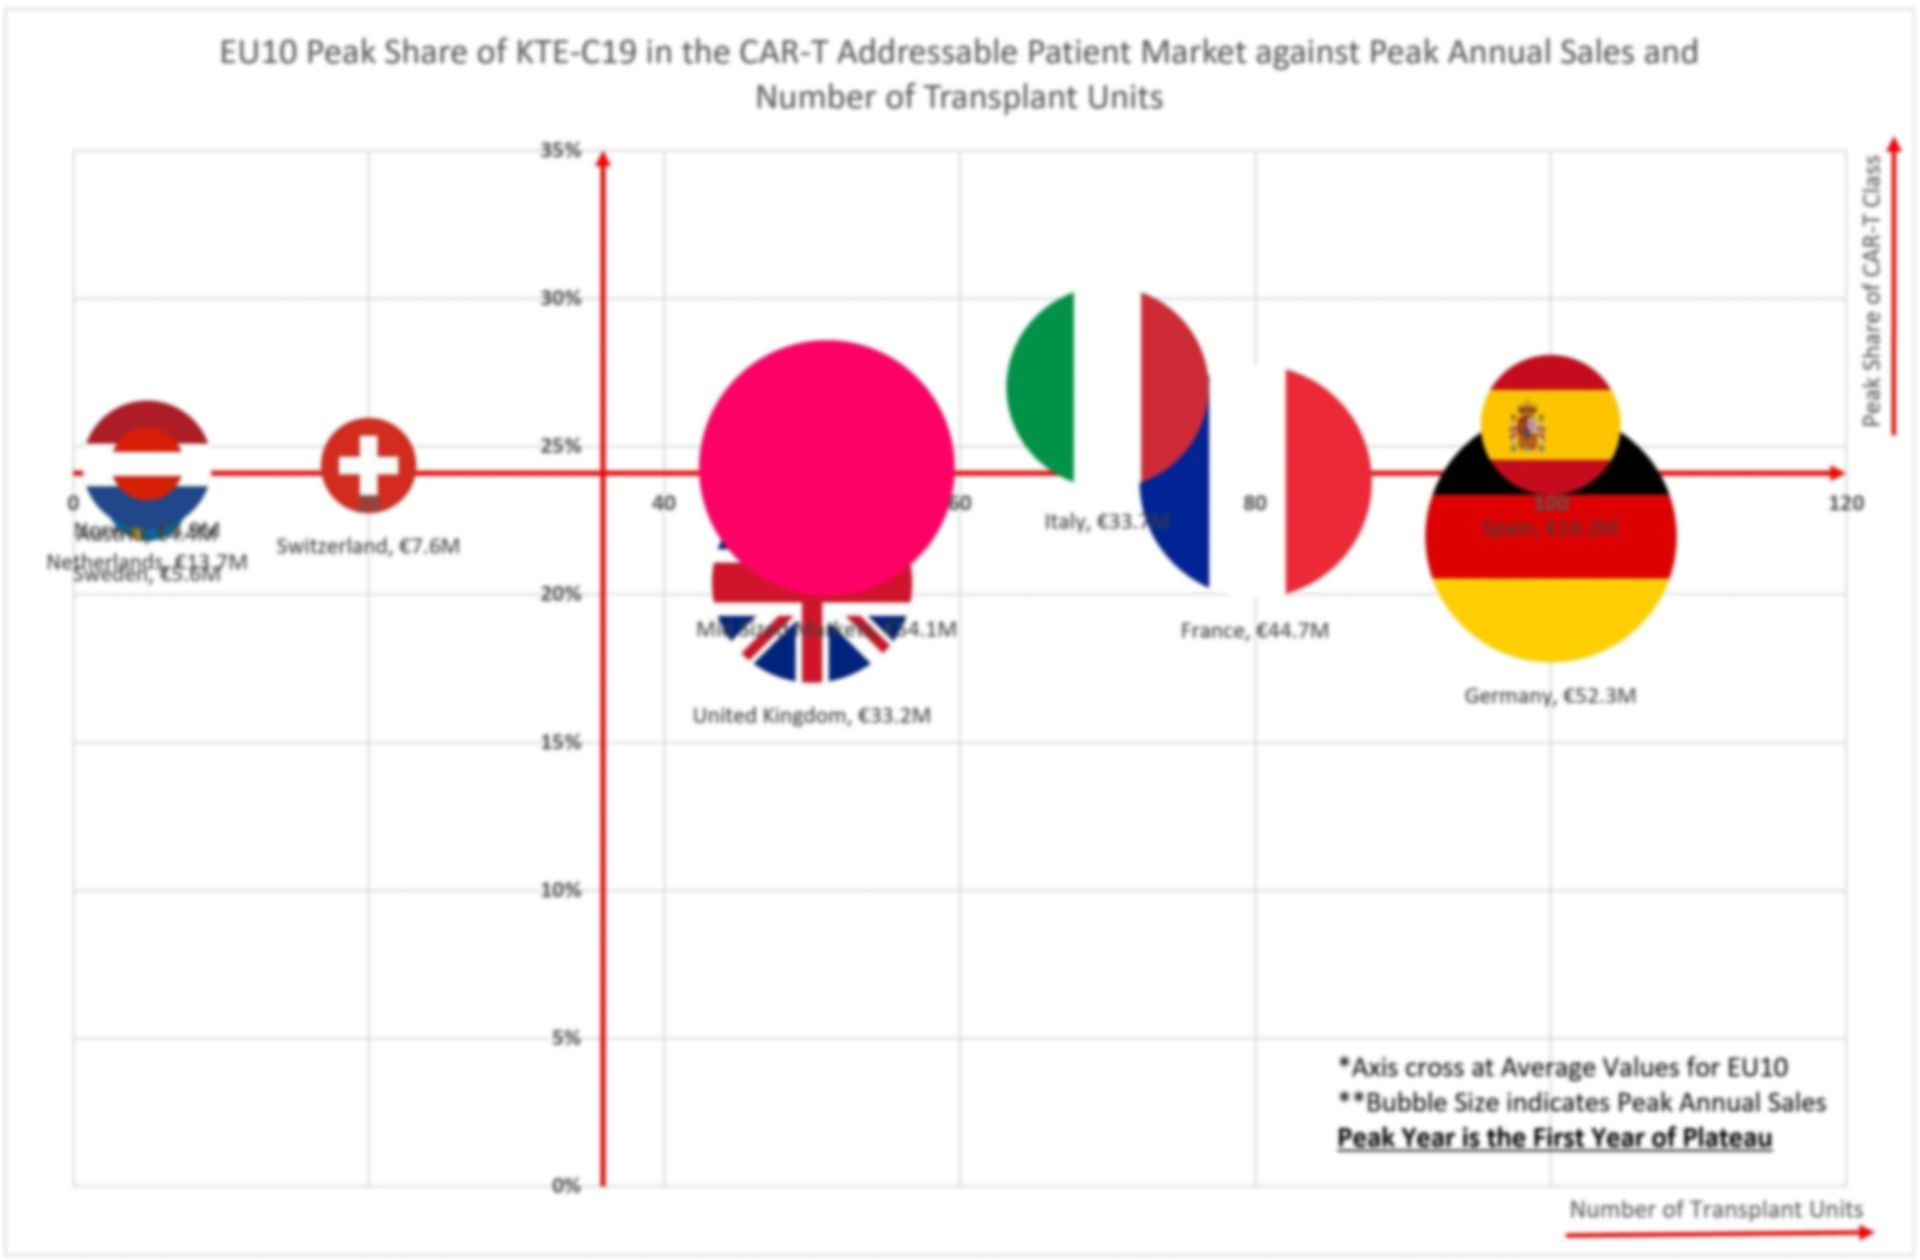
Forecasting CAR-T Patients
A start up Biotech company needed to understand the potential market, patient numbers and forecast sales line for a first in class paradigm changing cancer therapy. They required an interactive model that allowed for instant scenario creation resulting in an output of monthly patient potential, share and sales line along with a clear patient flow covering the first thirteen European markets to launch. They also required a research program to populate all assumptions and to inform Production and Finance depts
Project 6
Territory and Account Tracker
A Small-sized family owner Pharma company wanted an automated and interactive way to display their sales and unit share data by account, territory, region and by product and market. They were too small & specialised to justify the vast expense of an off the shelf reporting tool and wanted something far more aligned to their specific needs.
This tracker was designed to identify which accounts where performing well and which were failing. This gave each Representative a real time feed of their accounts linked directly to the company's warehouse ensuring they could plan effectively and efficiently
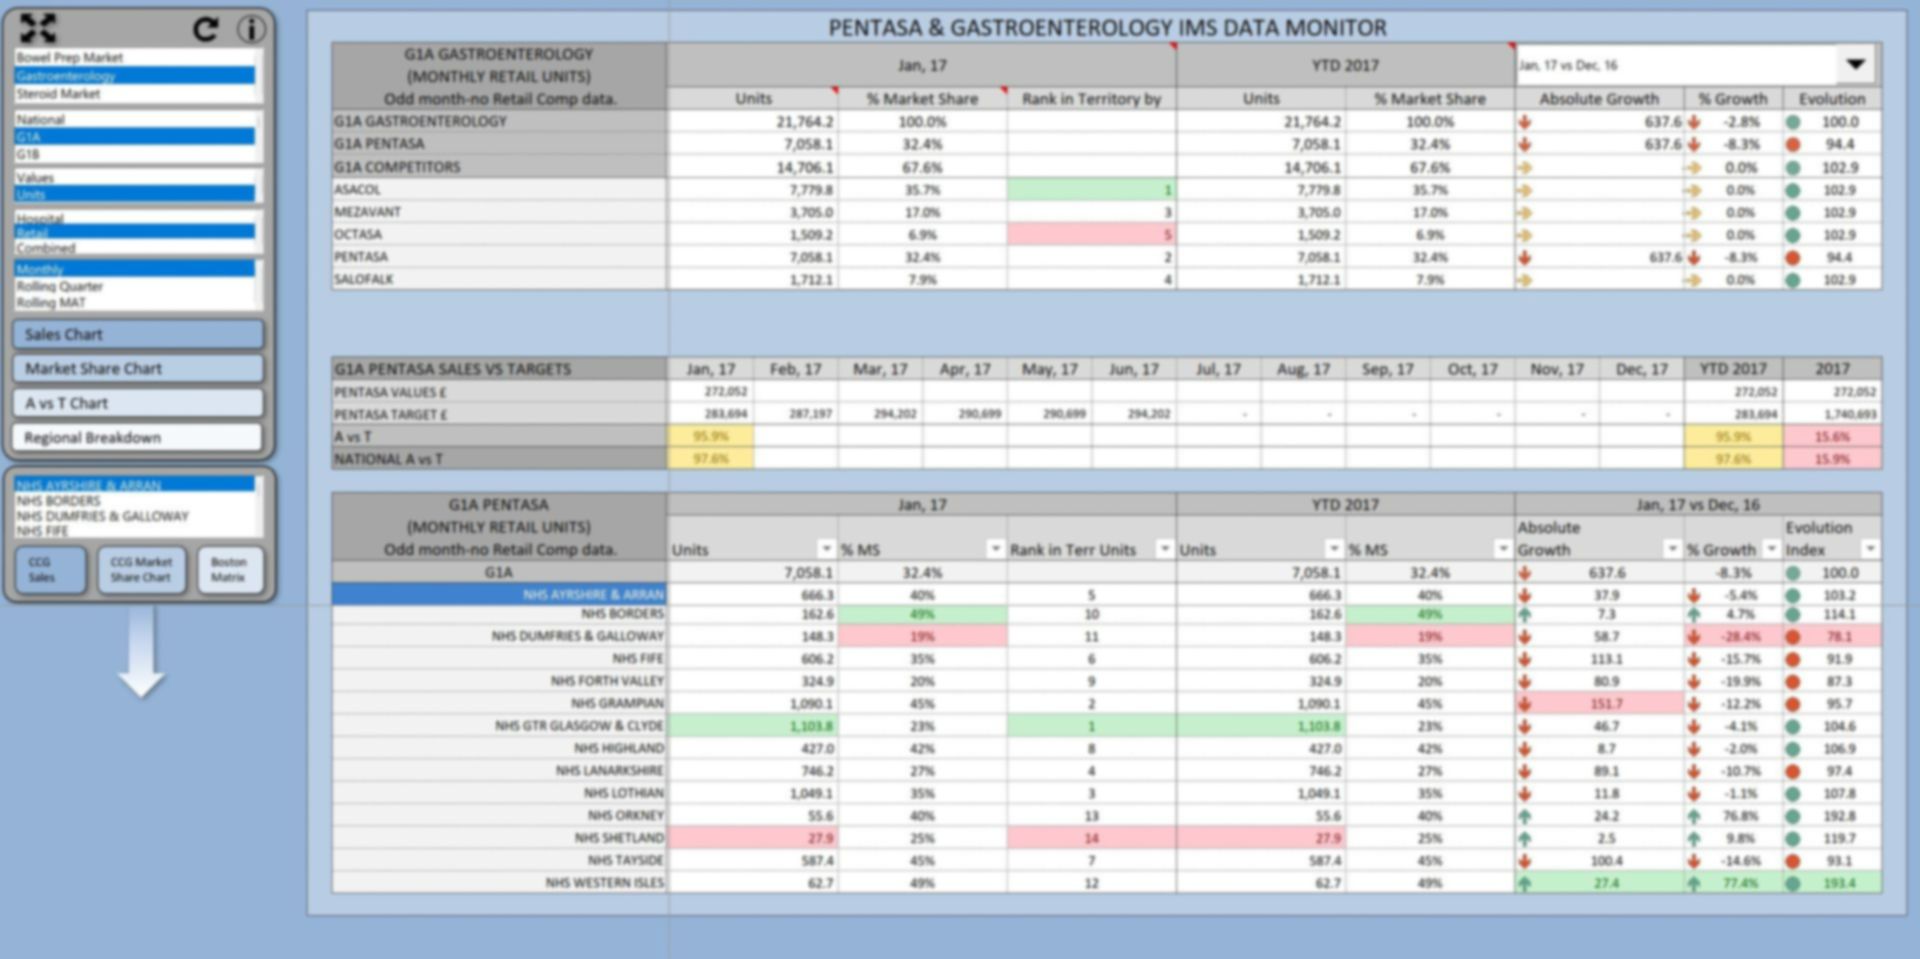
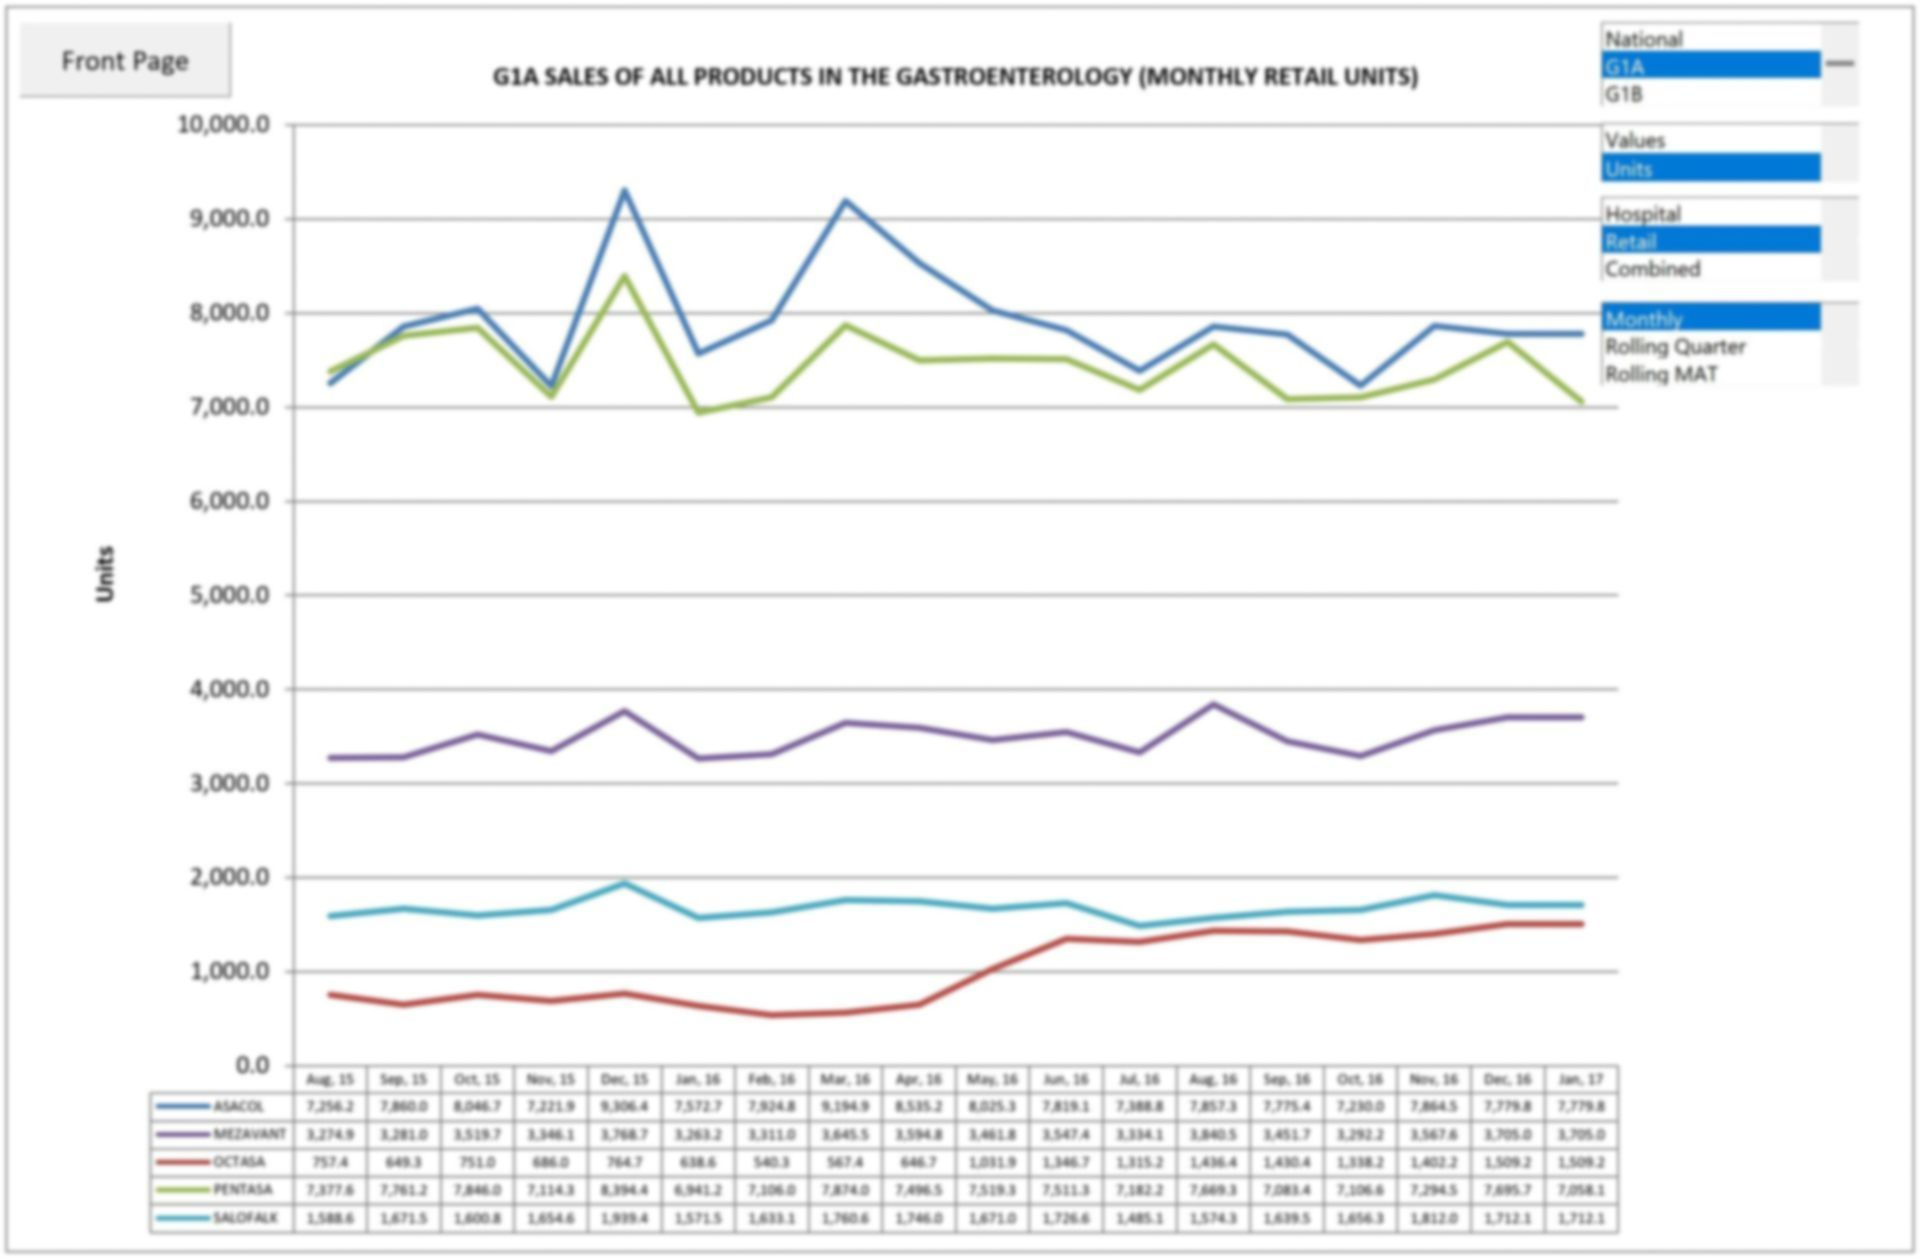
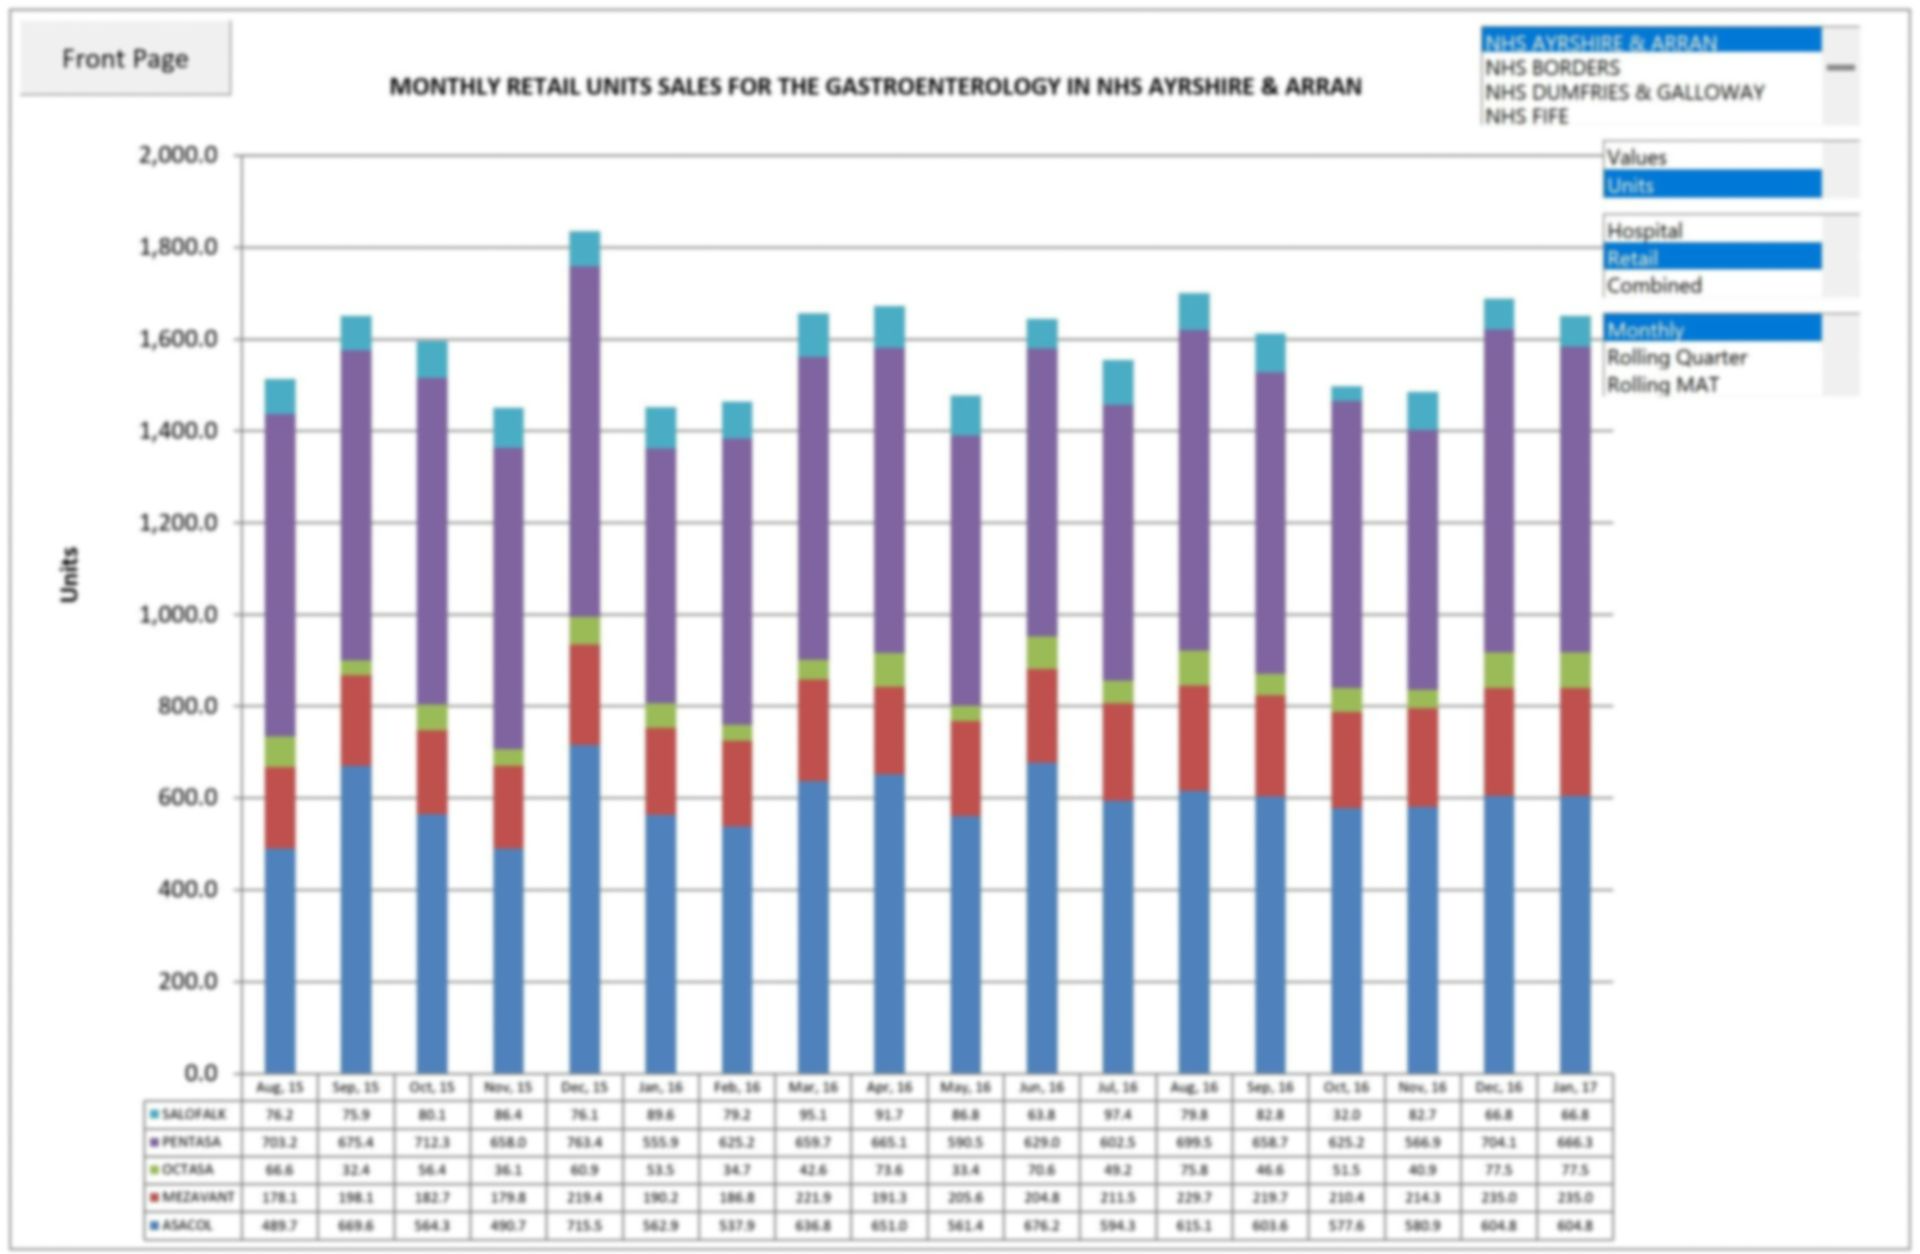
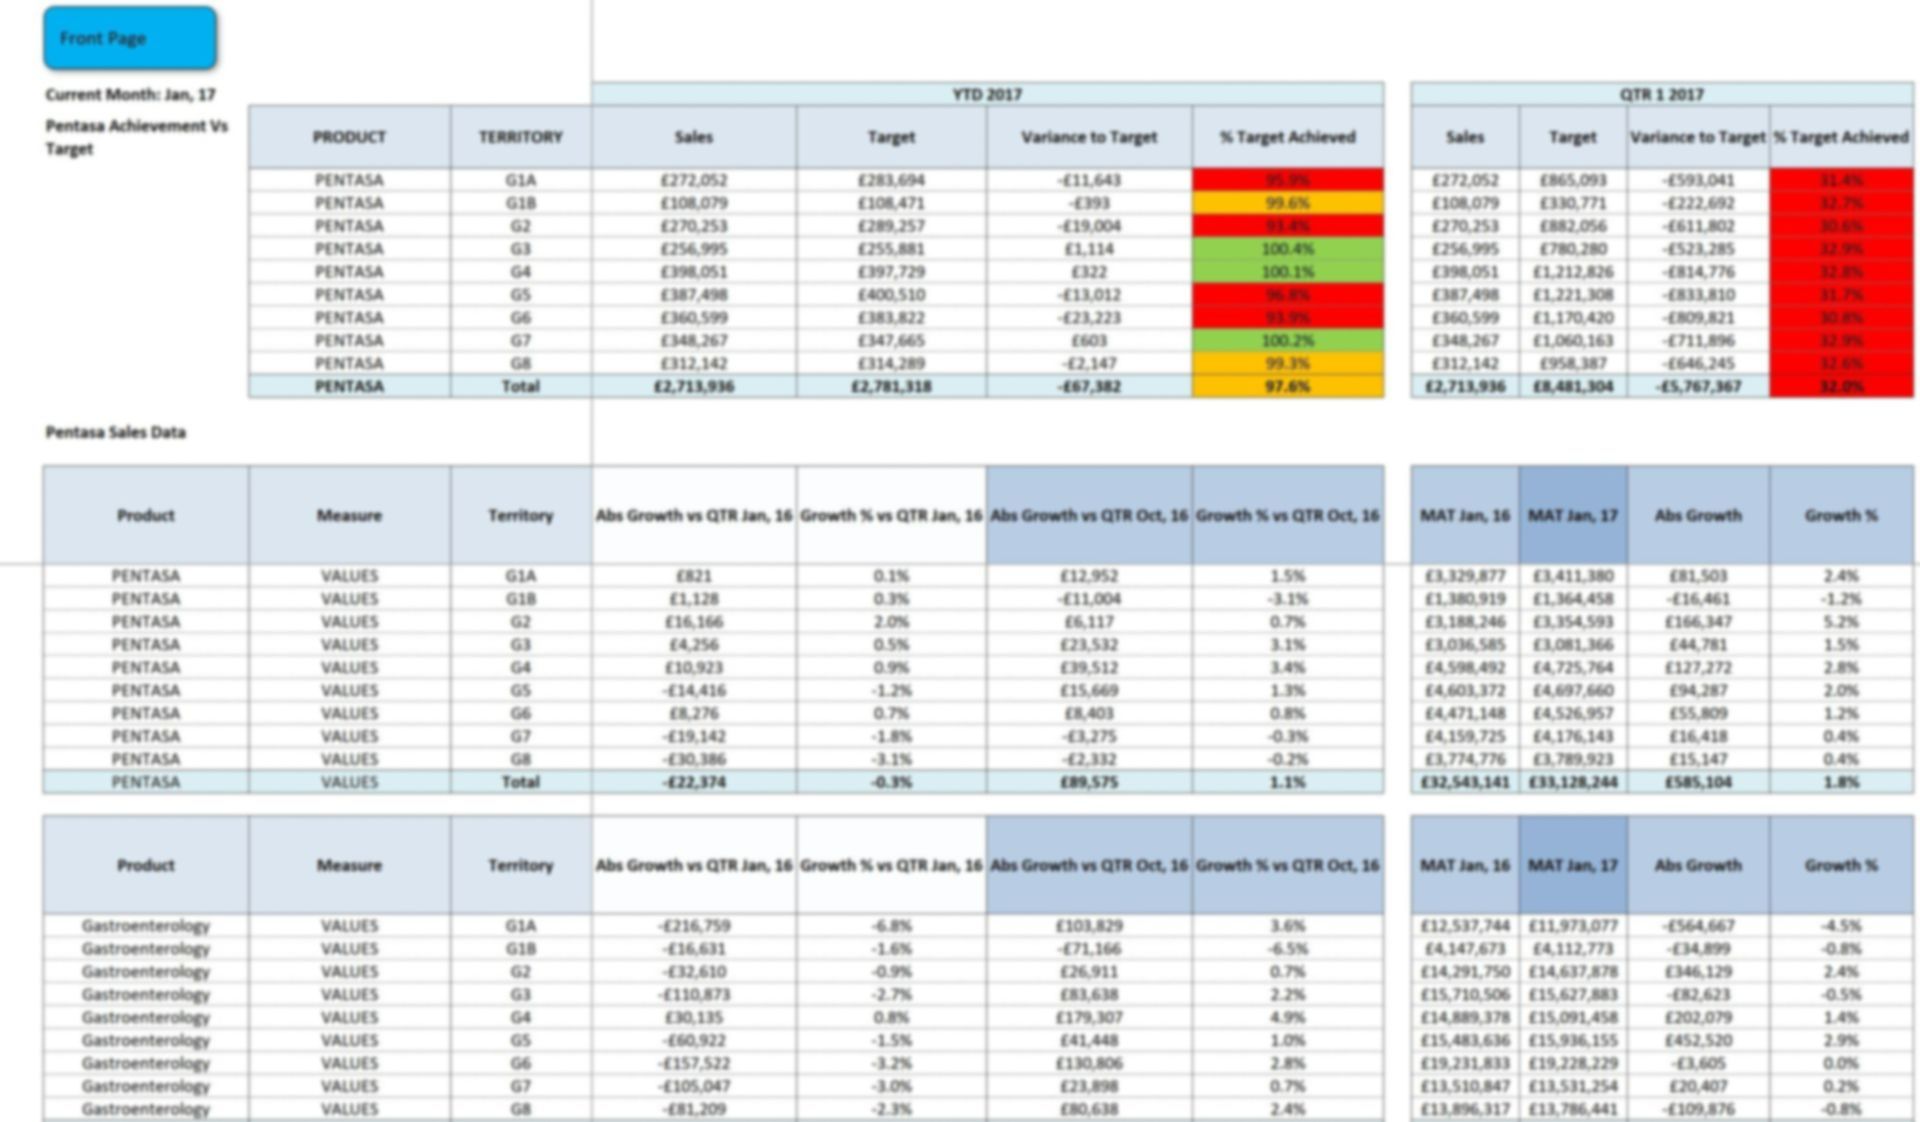
Project 7
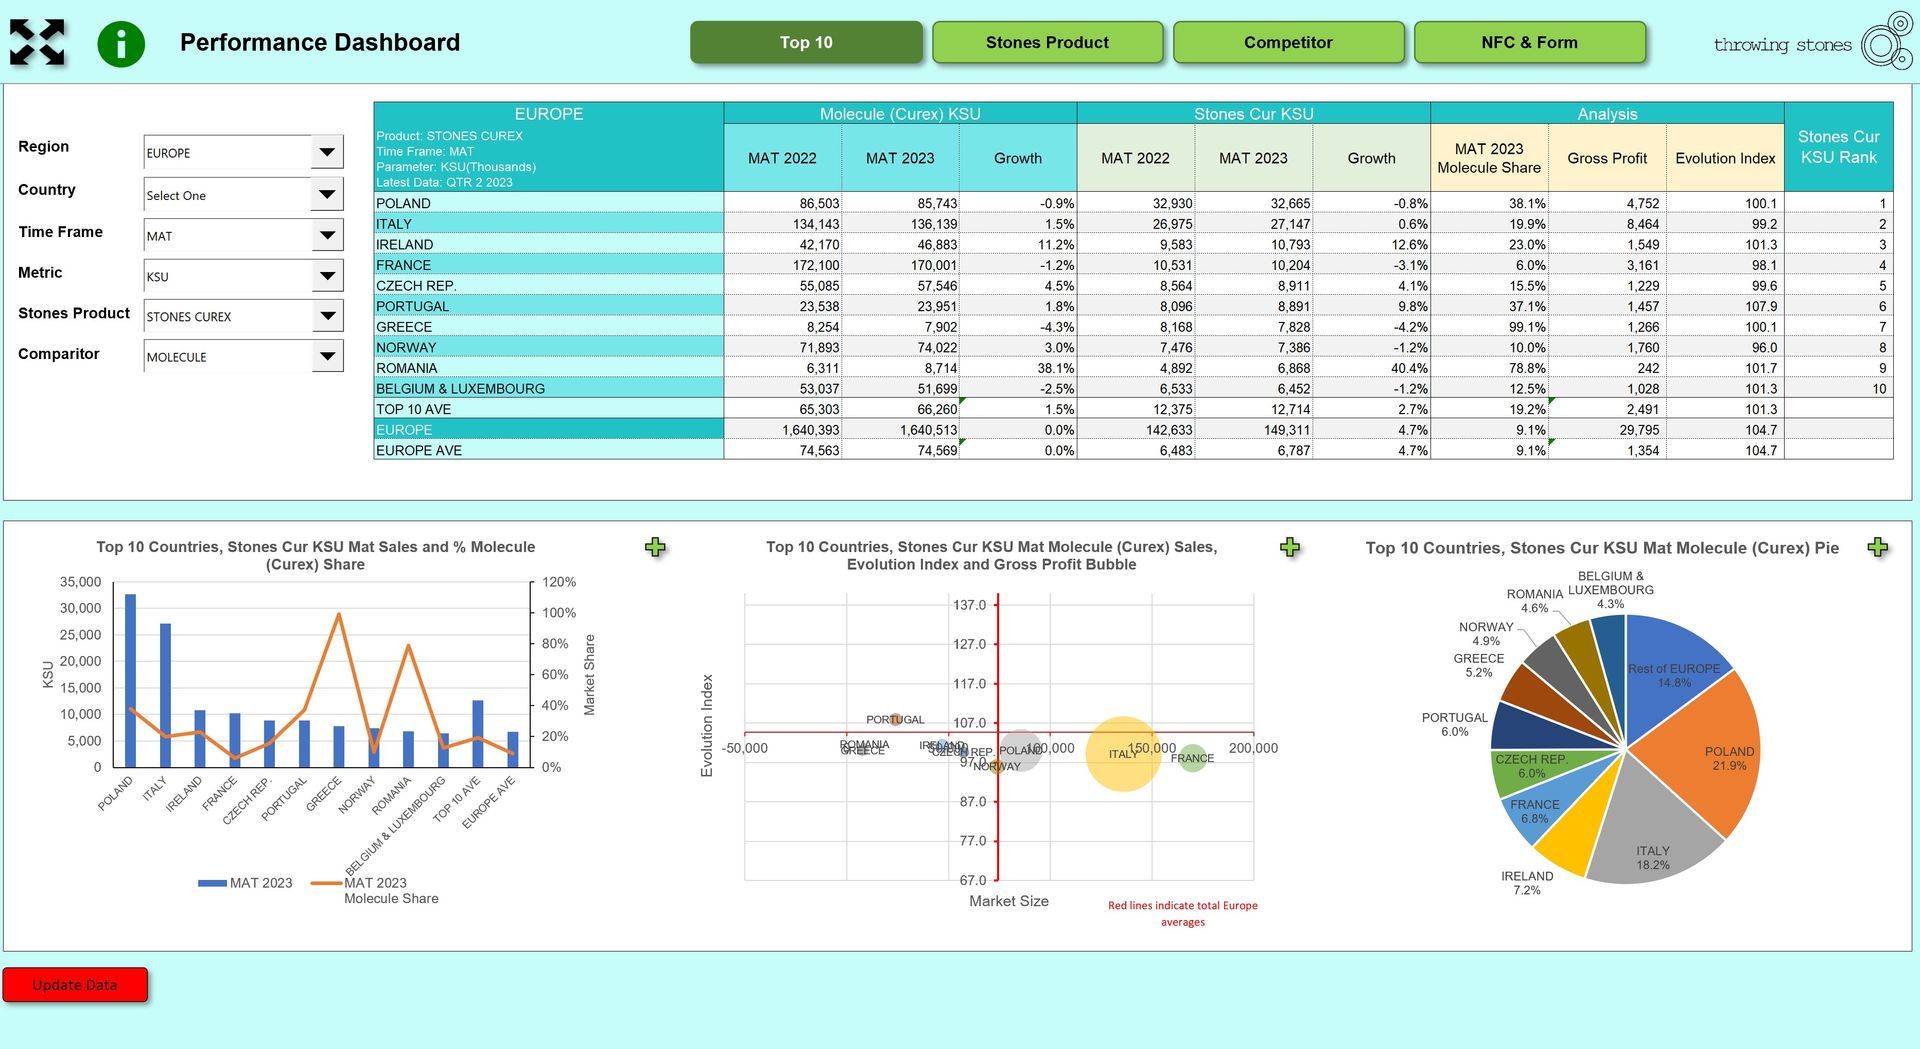
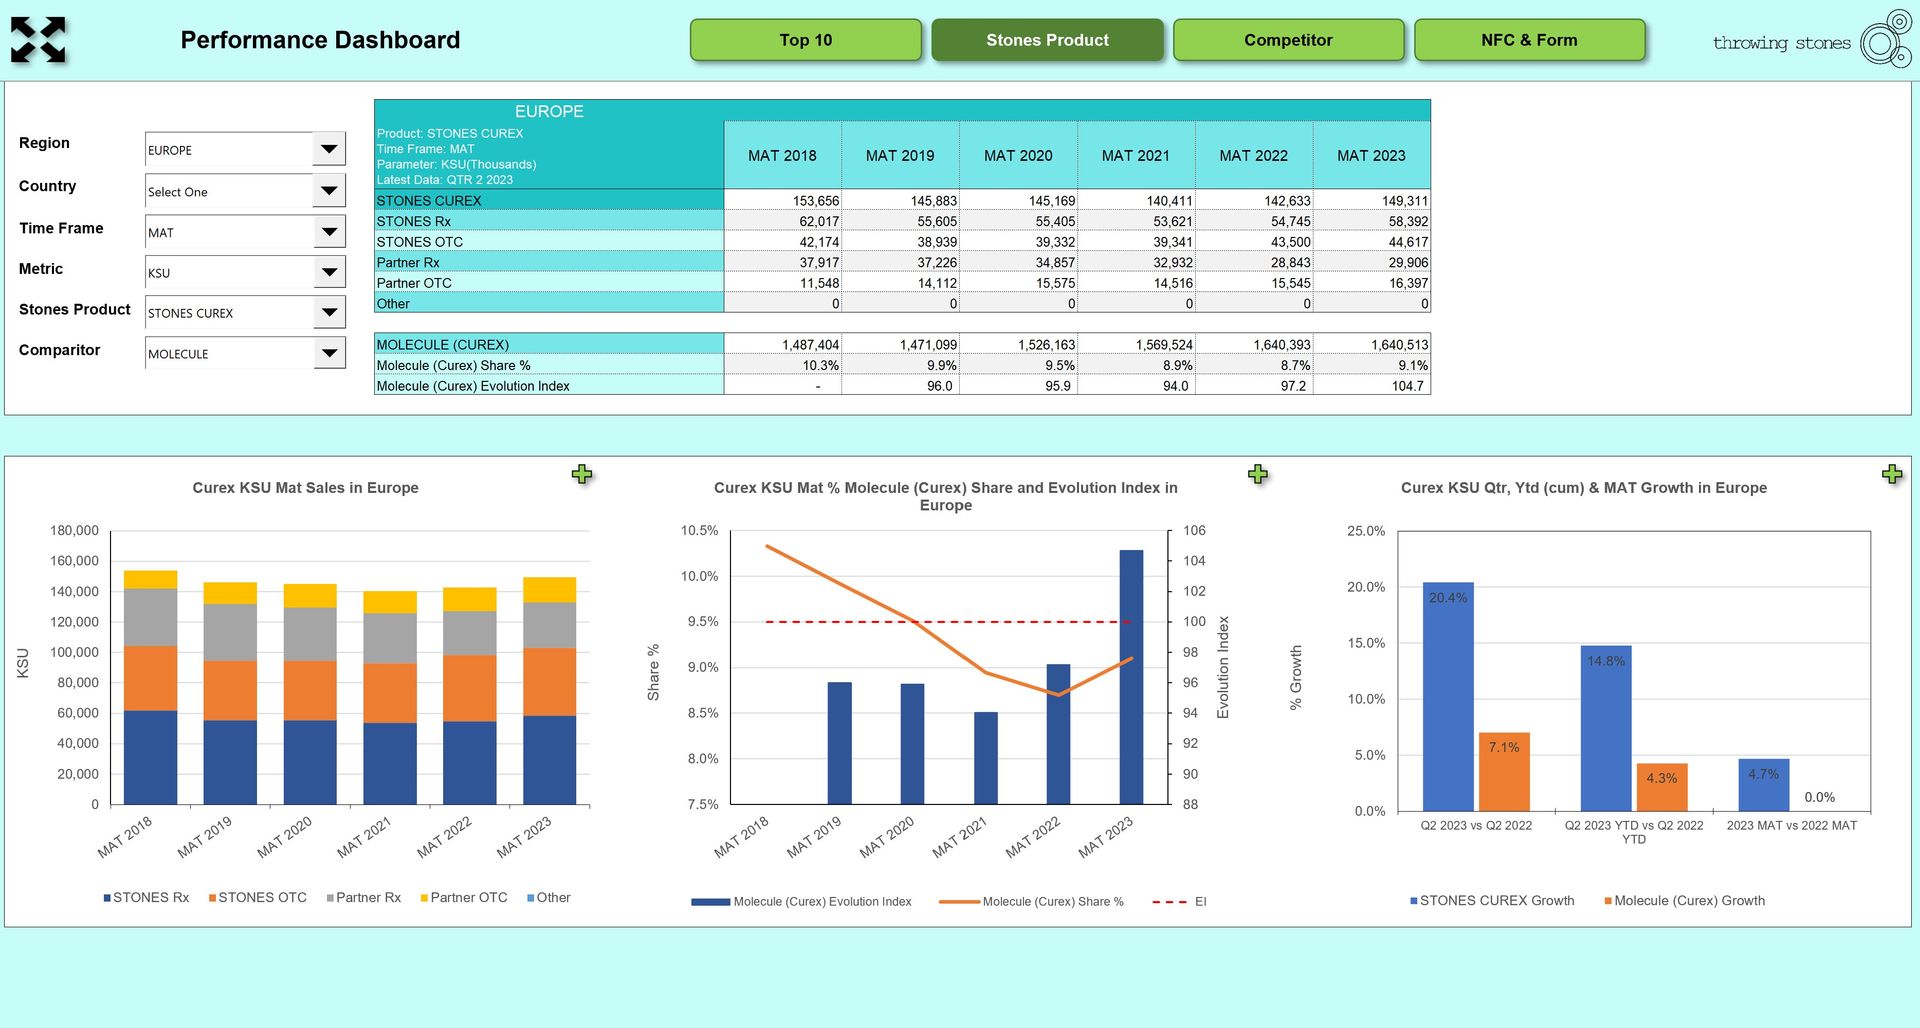
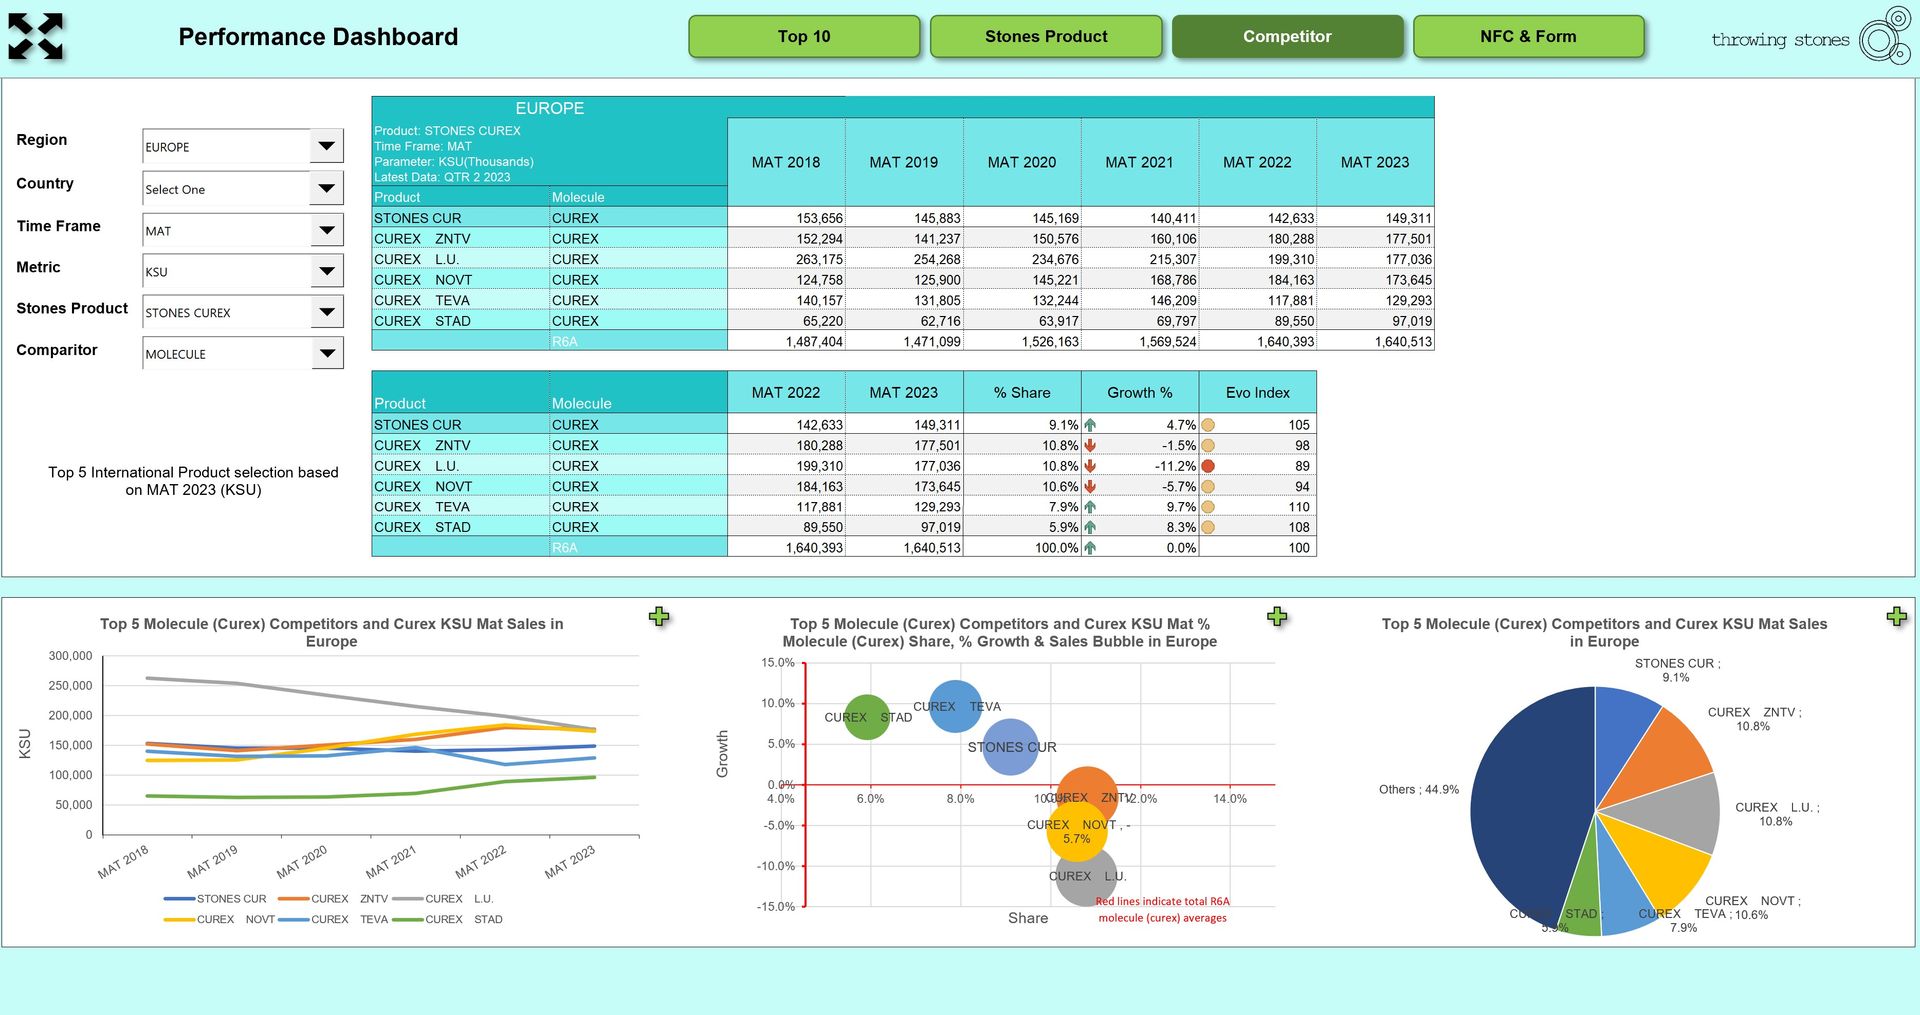
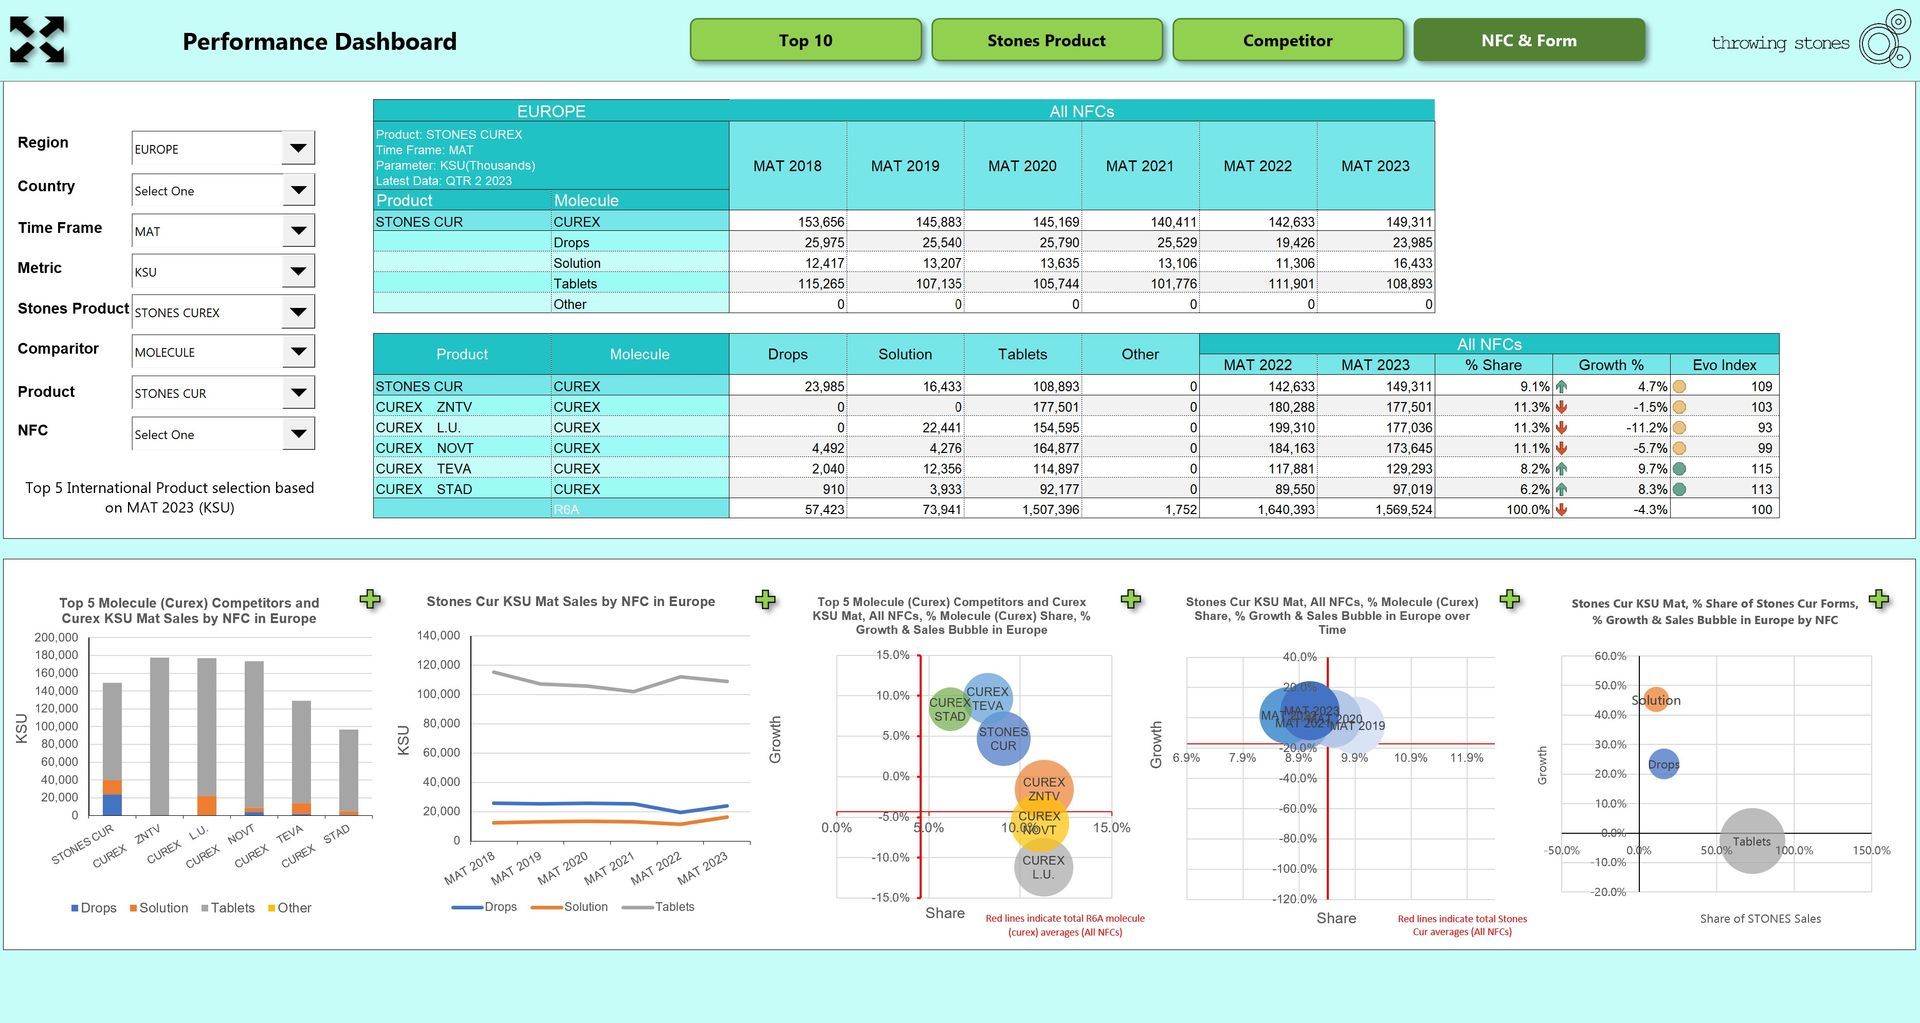
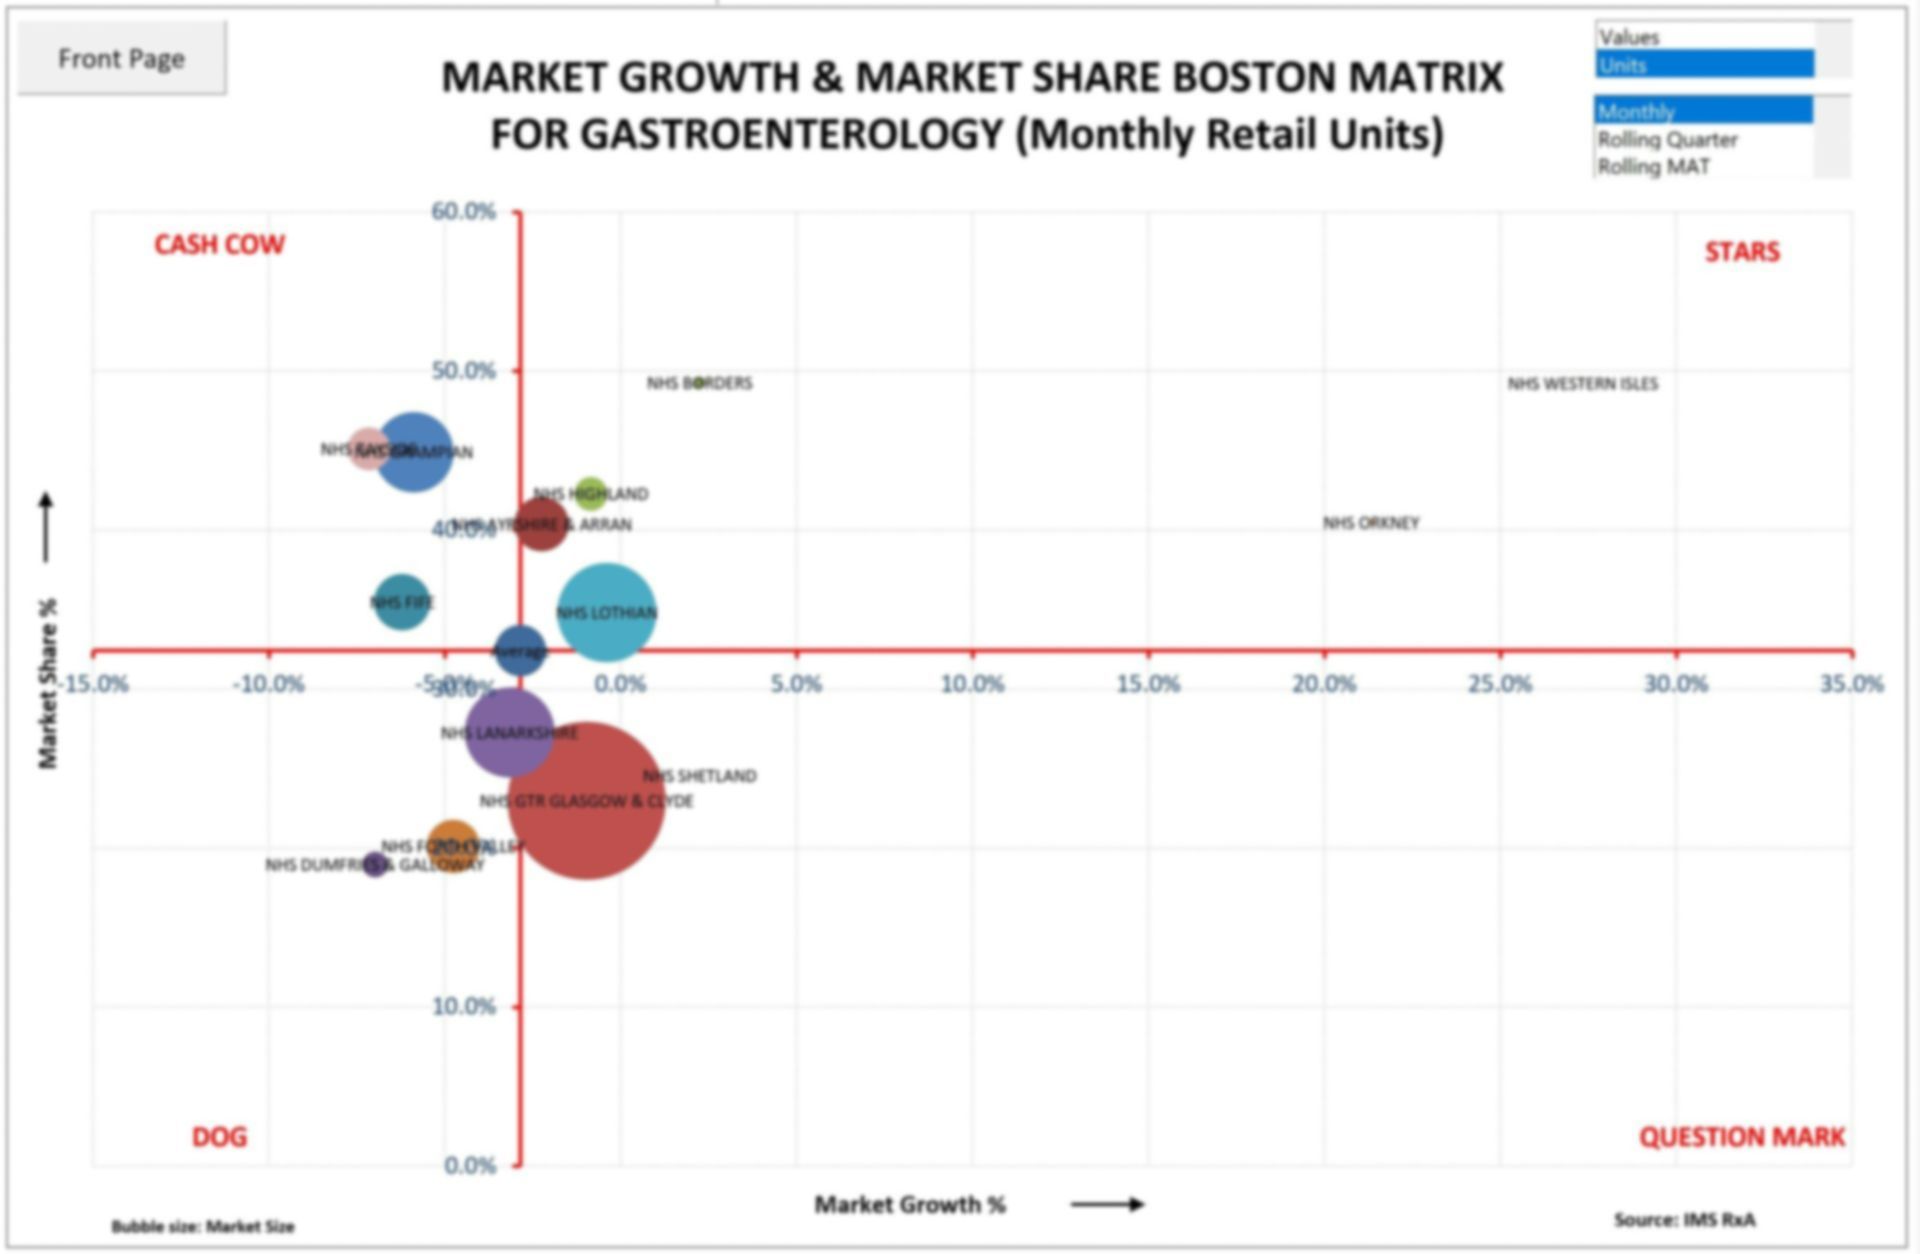
Performance Dashboard
A Mid-size company wanted to replace their tired and large (100mb) ms Excel dashboard with a smaller, more interactive tool that would focus on providing insights and intelligence rather than just regurgitating data in a dry, spreadsheet format.
We took all their existing data, added additional fields such as finance data, market data, molecule data for increased analysis. We added interactivity so the end user could hand select their data views and created a huge amount of focused graphics that fed their standard monthly performance plans and presentations such as bubble charts, boston matrices, sales against target, movement over time, identification of wins and losses and so on. At the same time we managed to put it in a protected 4mb tool
Project 8
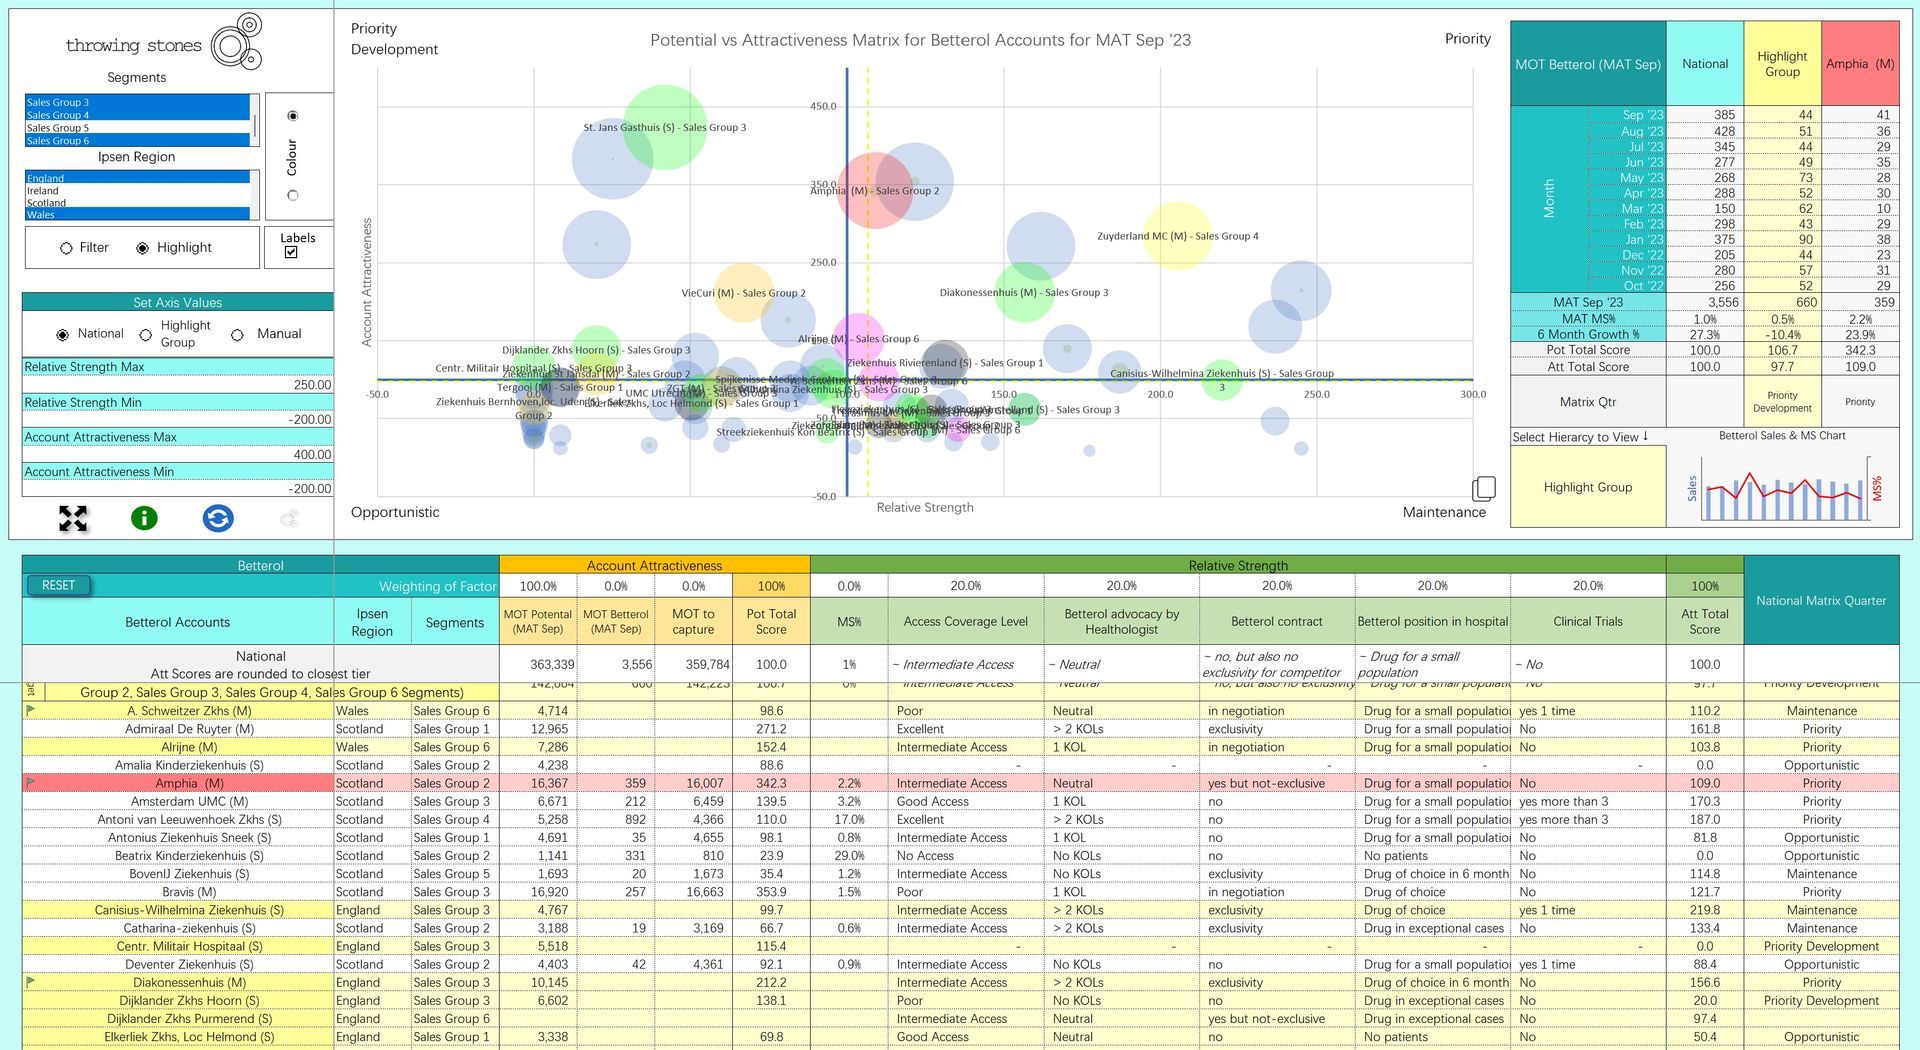
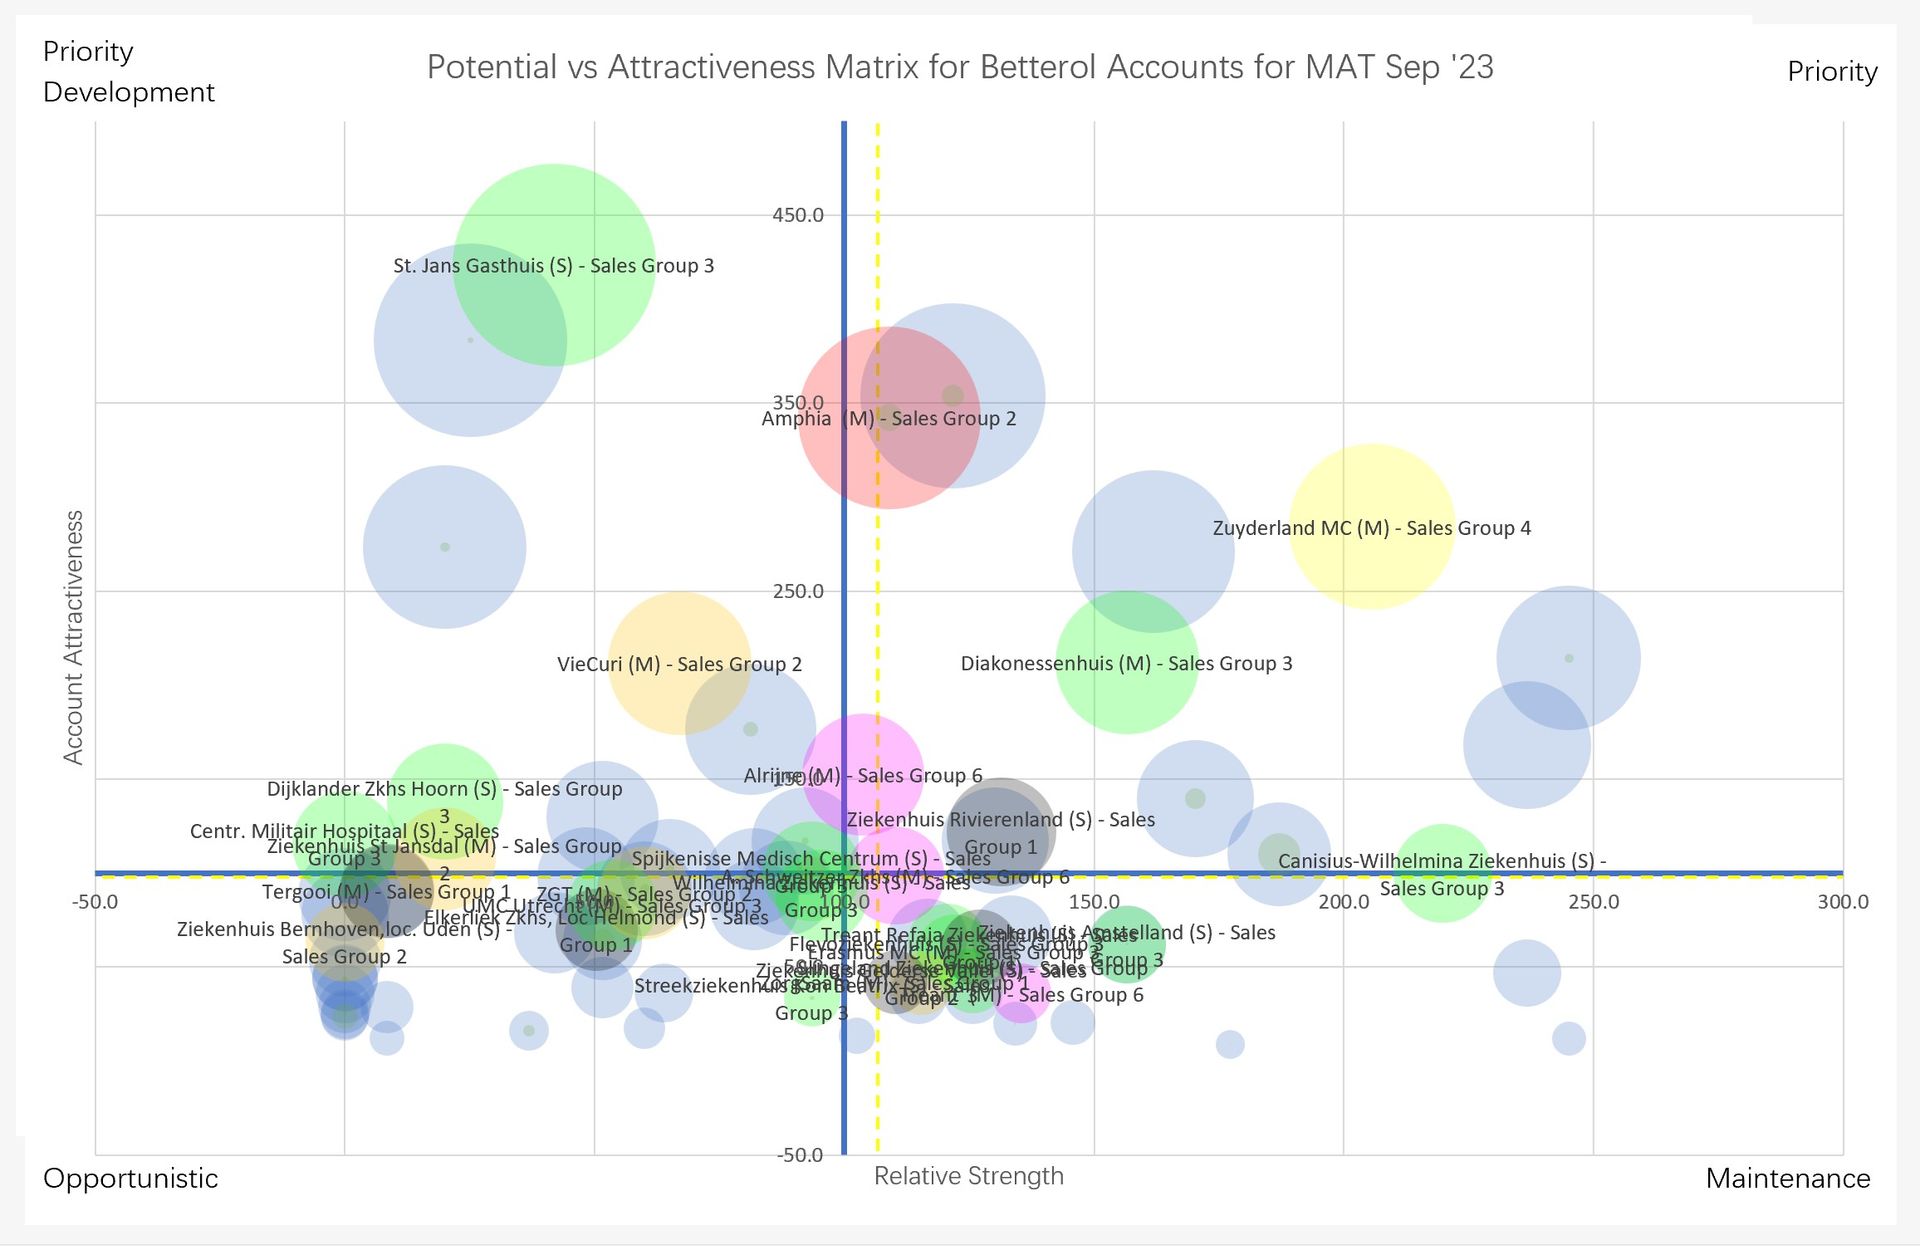
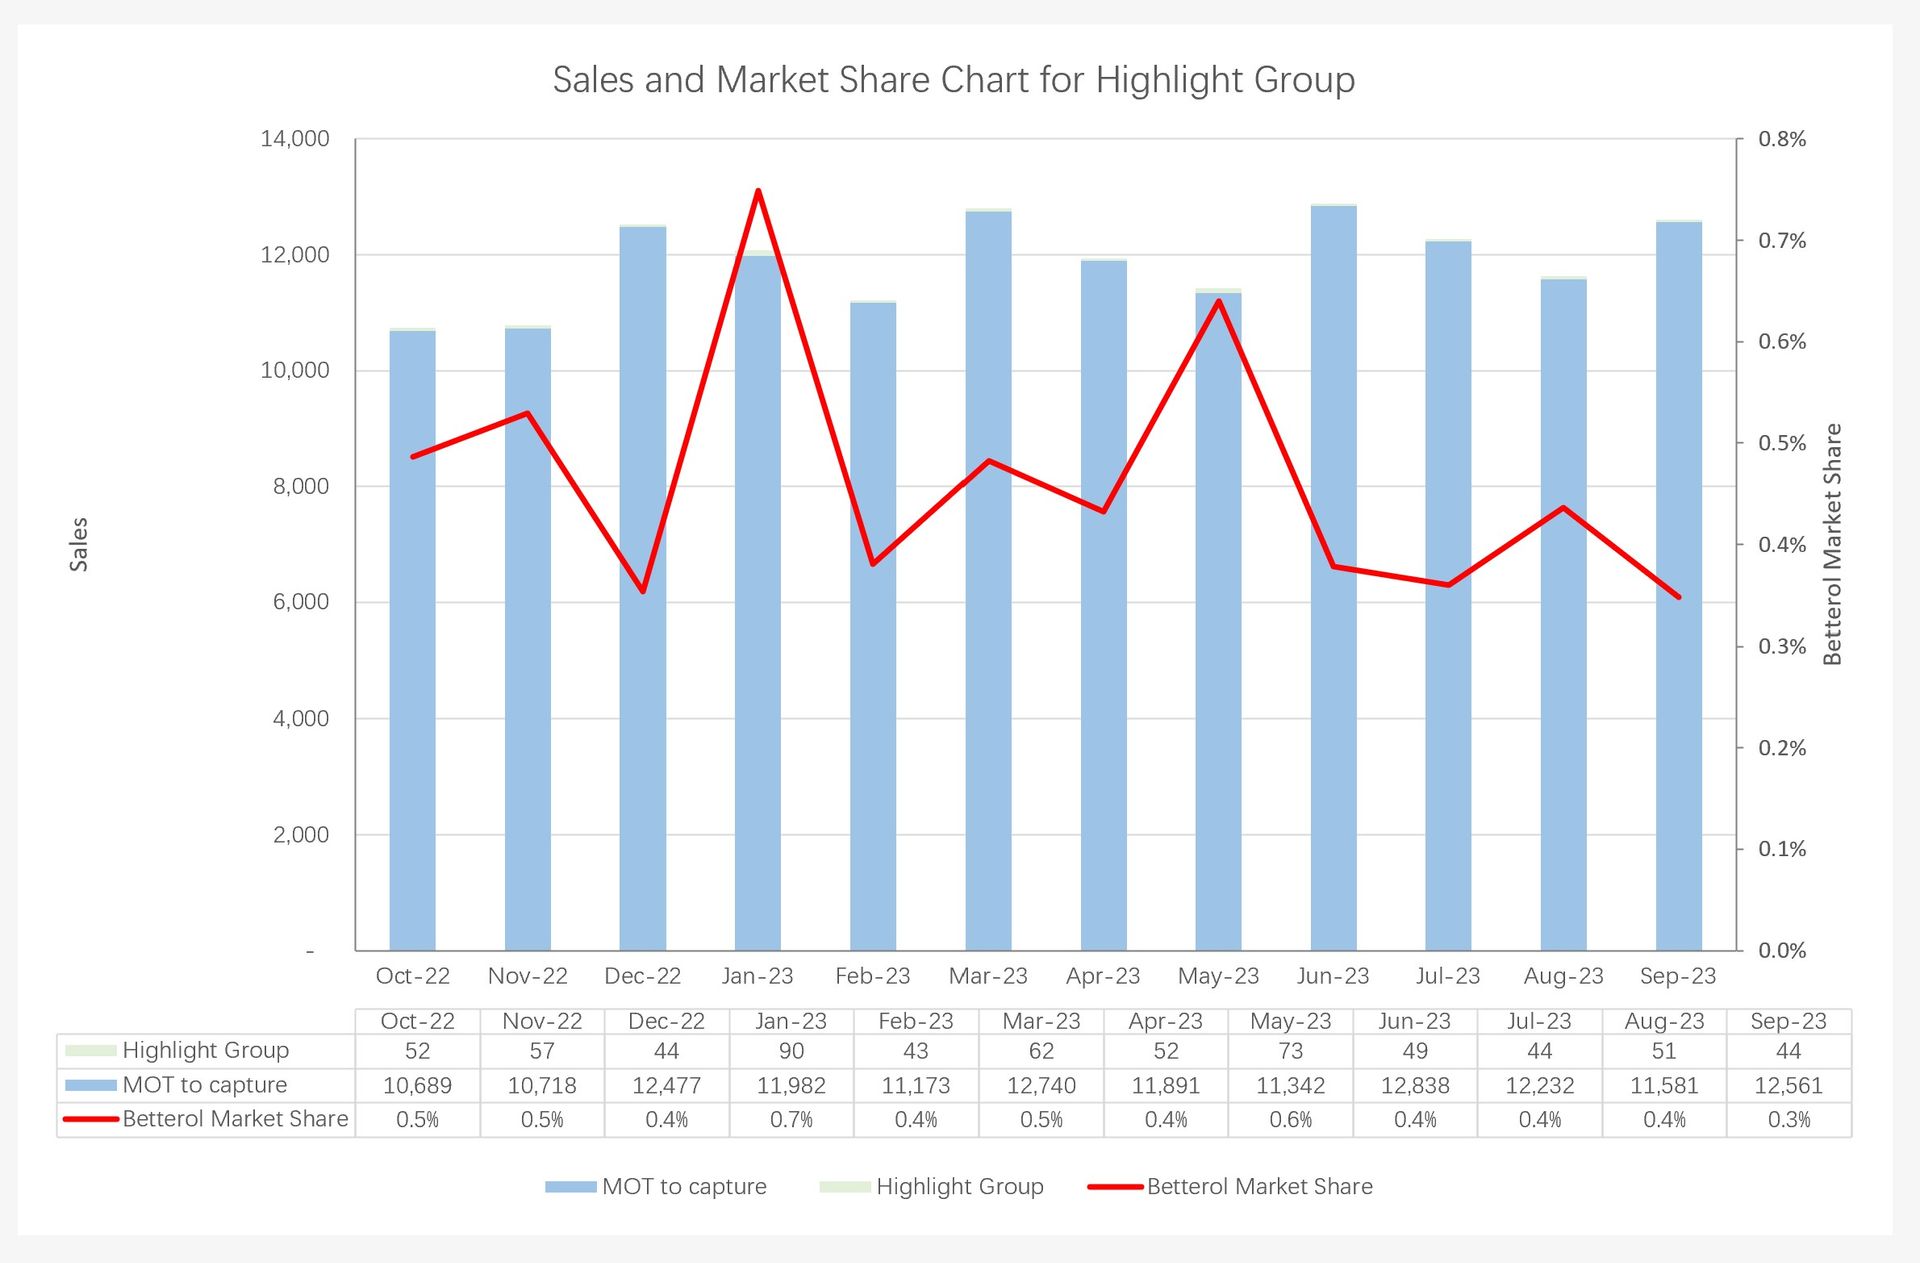
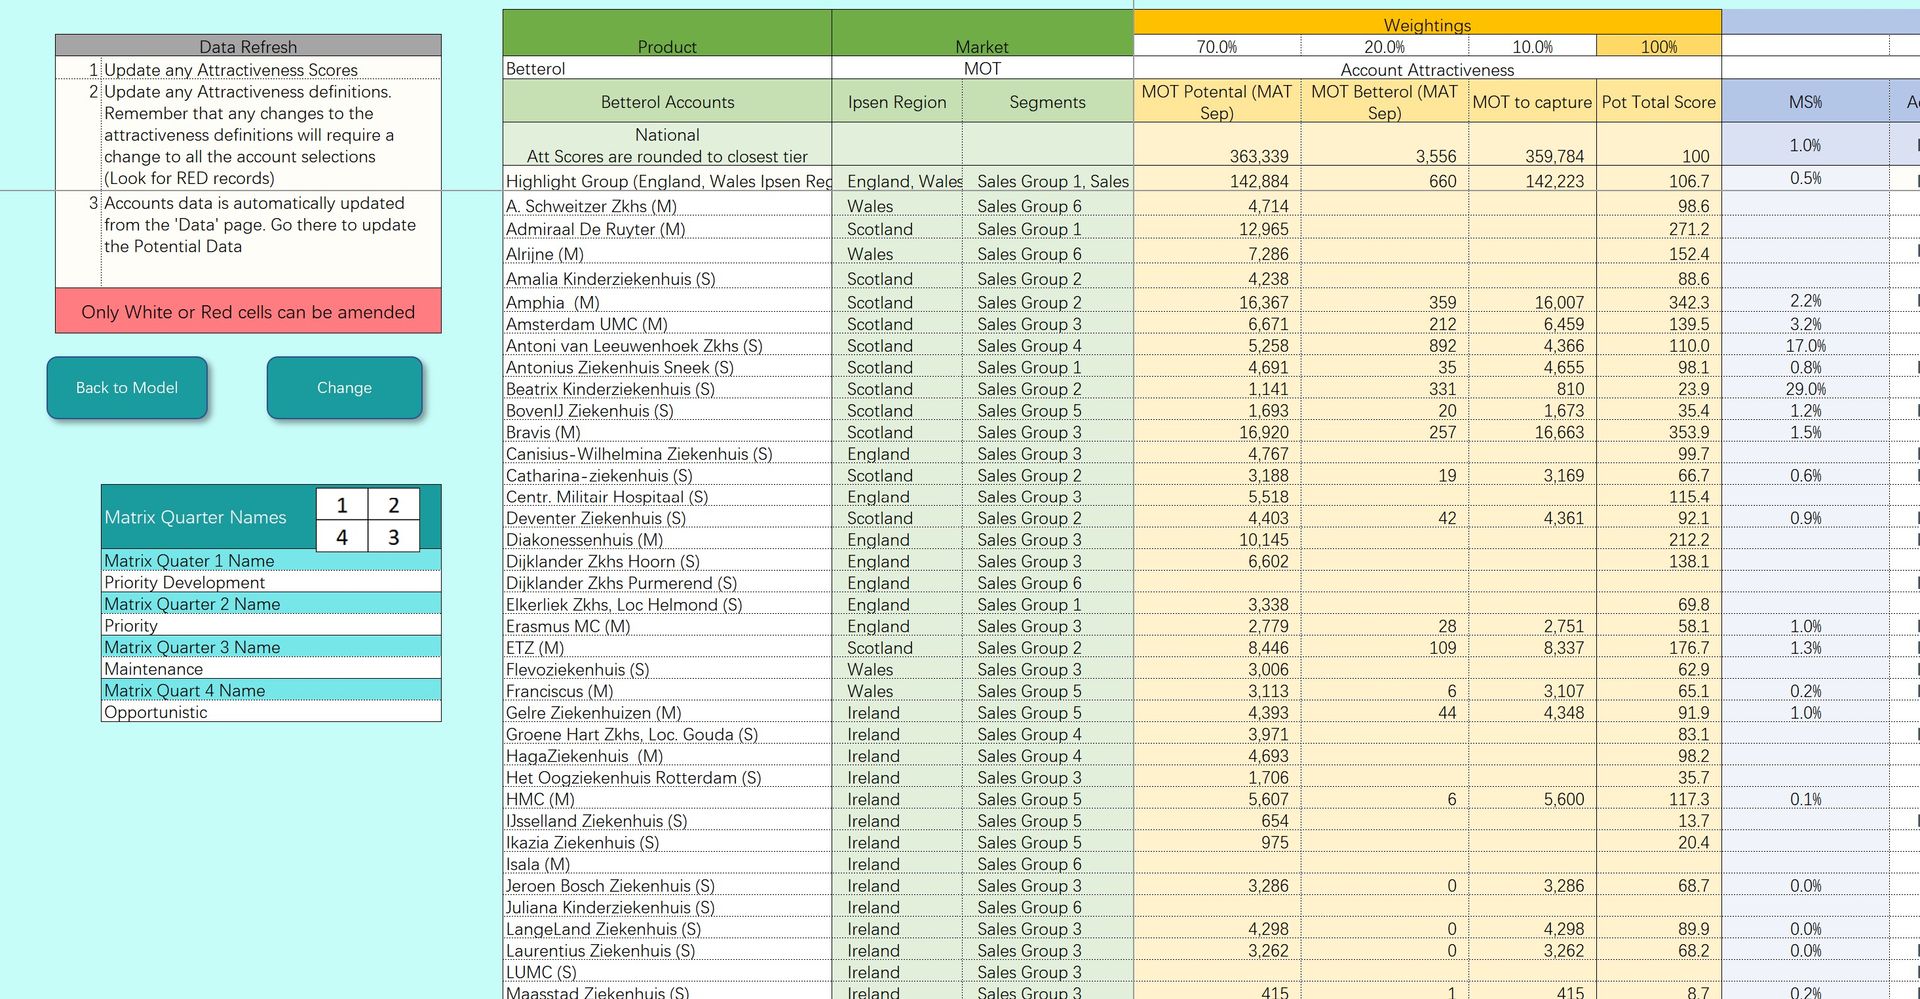
Targeting and Segmentation
A Mid-size European company wanted to ensure they were targeting the correct Hospitals and Accounts using the pertinent closed loop marketing methodology.
In conjunction with a specialist targeting consultancy we developed a tool that allows use of qualitative and quantitative measures simultaneously in creating segments. This tool allowed users to filter by territory and group, showed potential and share in bubbles, displayed 24 months of data with trends and enabled users to make instant and dynamic changes. It also allowed comparisons with National and subnational levels along with manual axis selections
Project 9
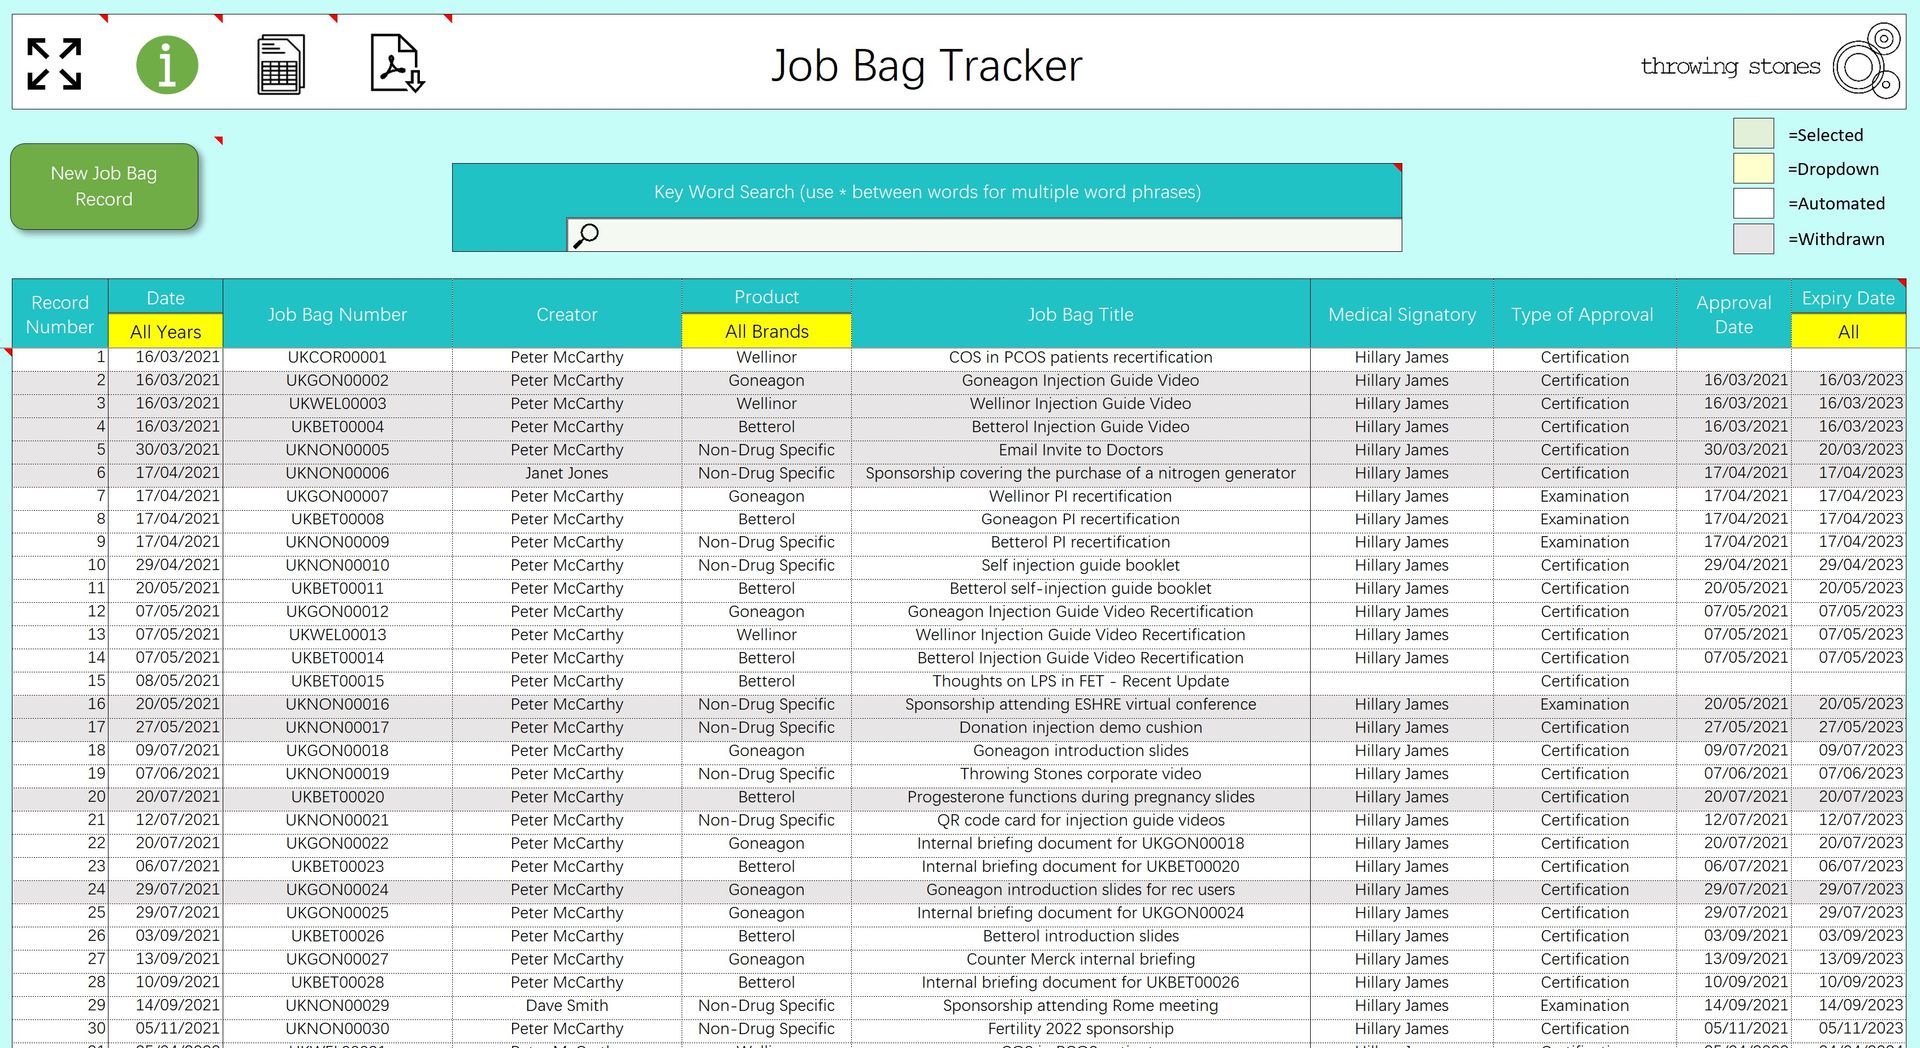
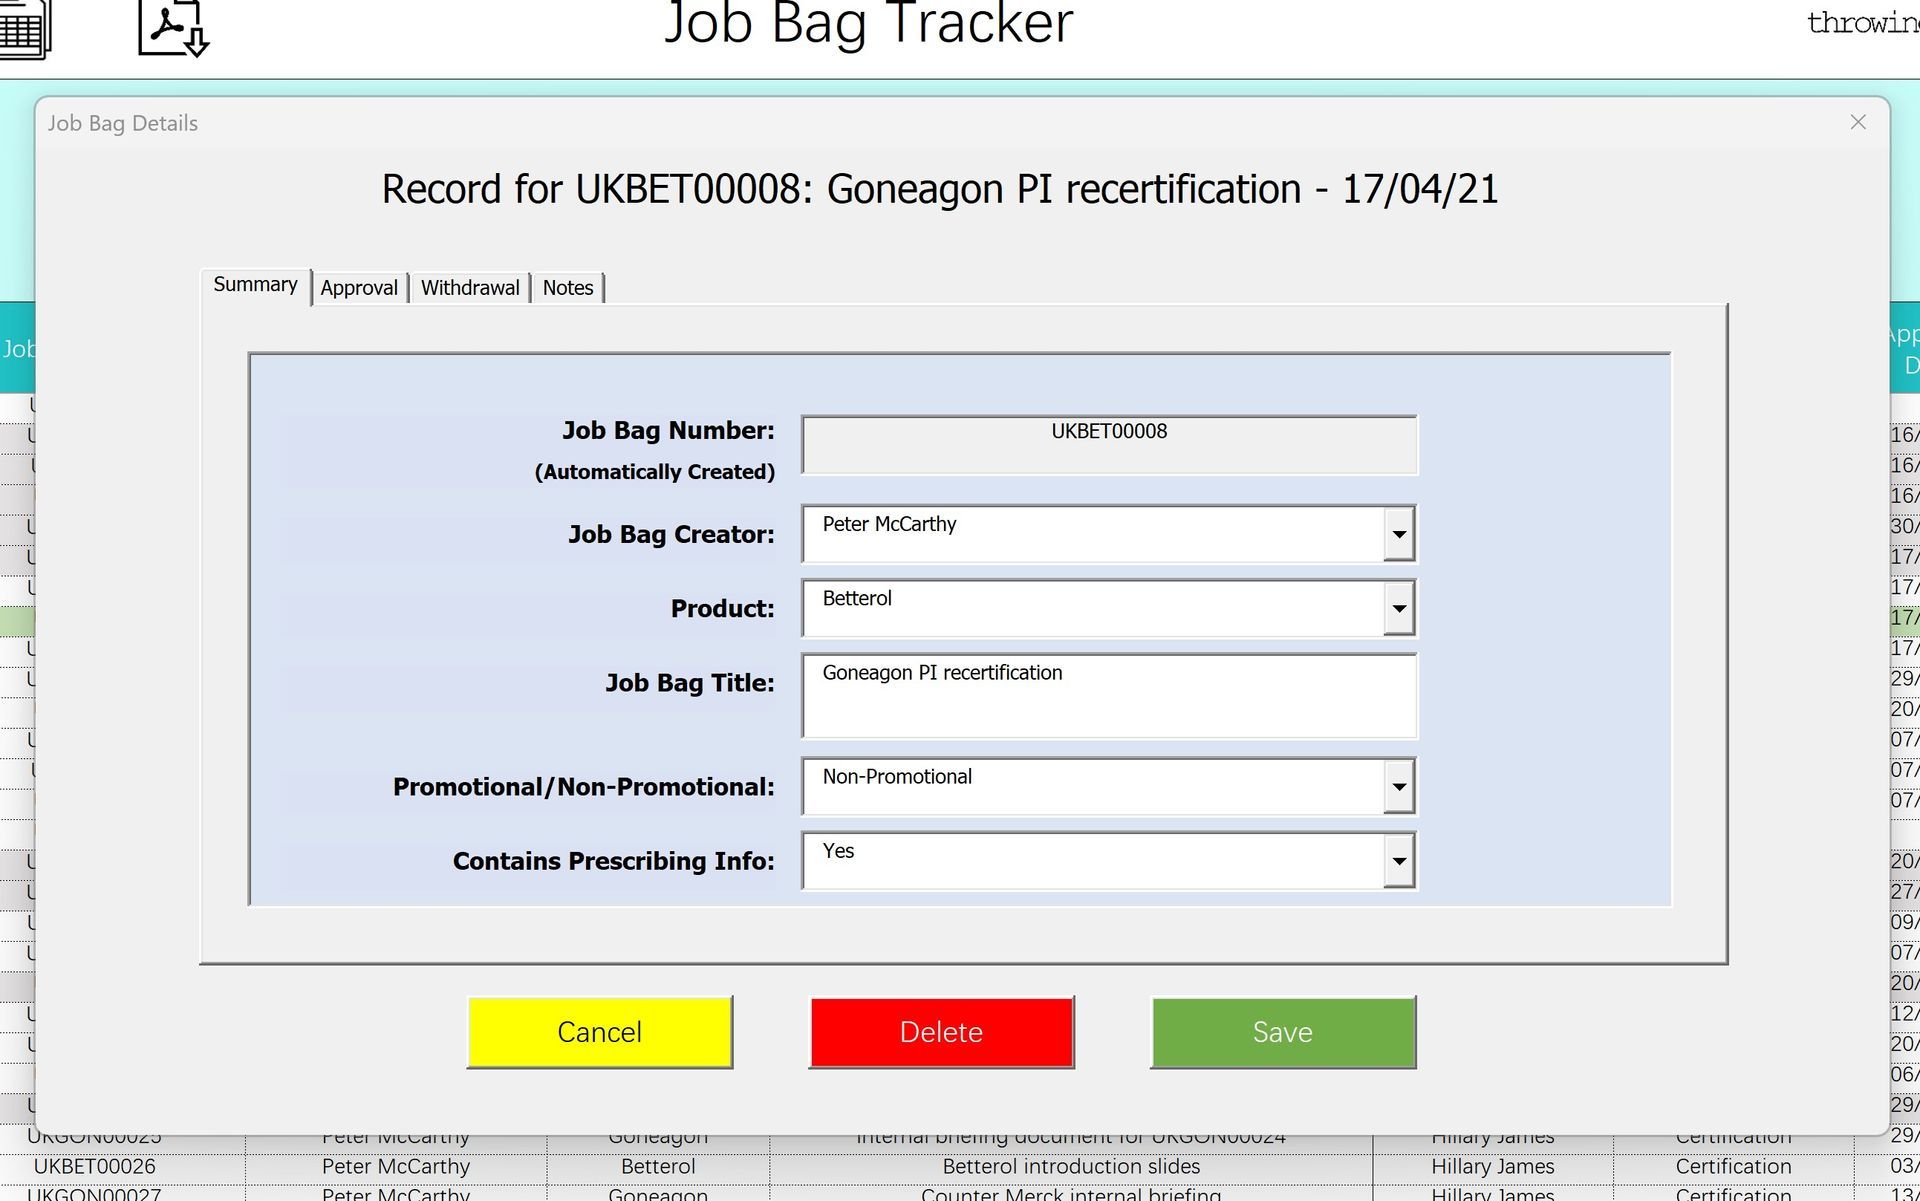
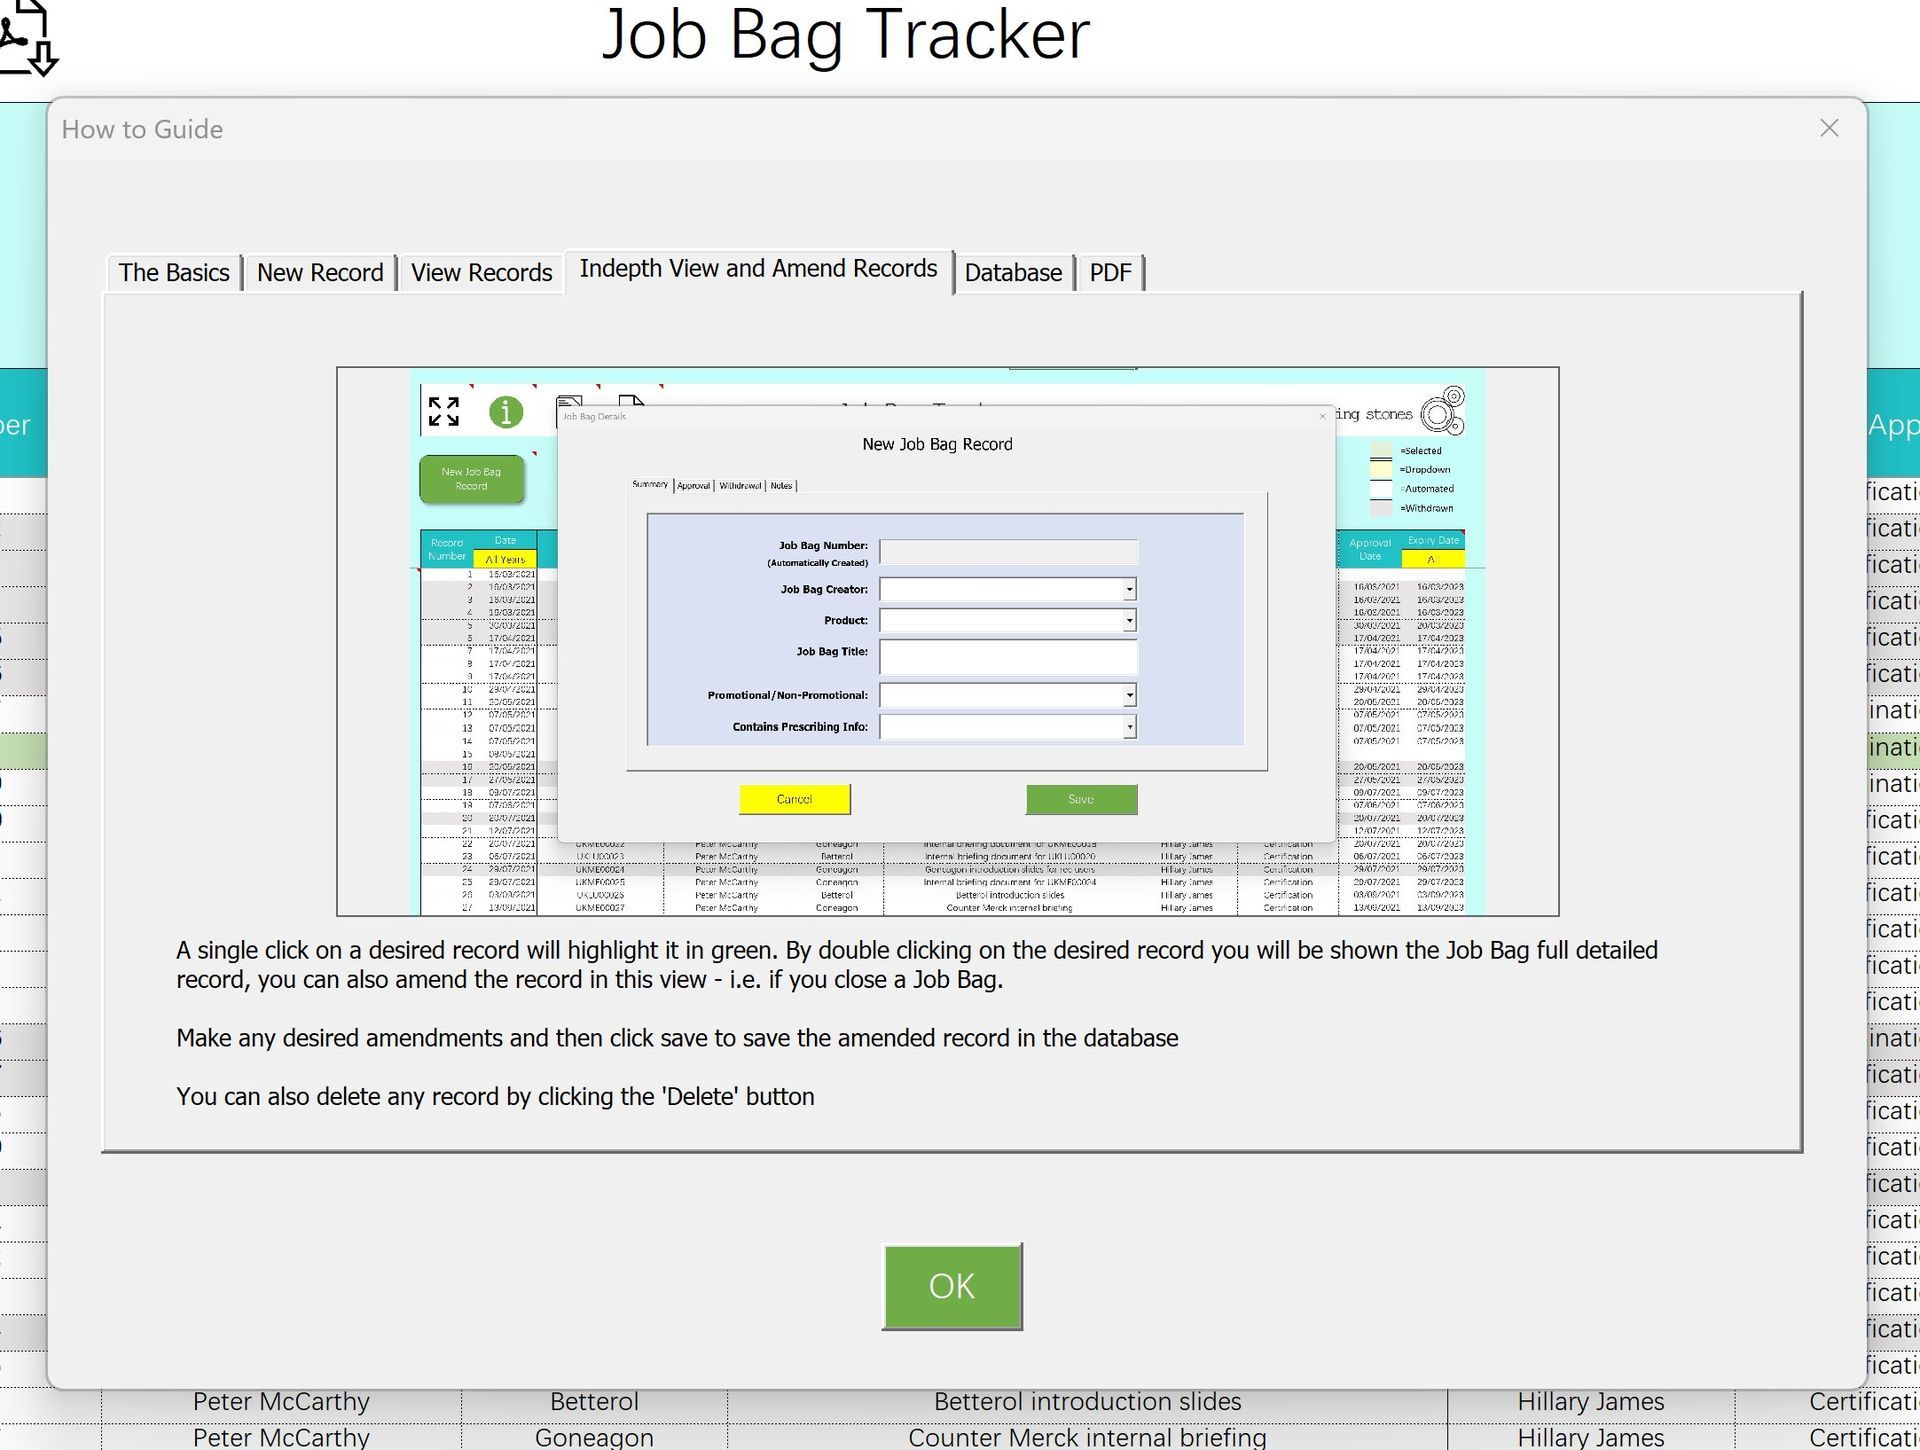
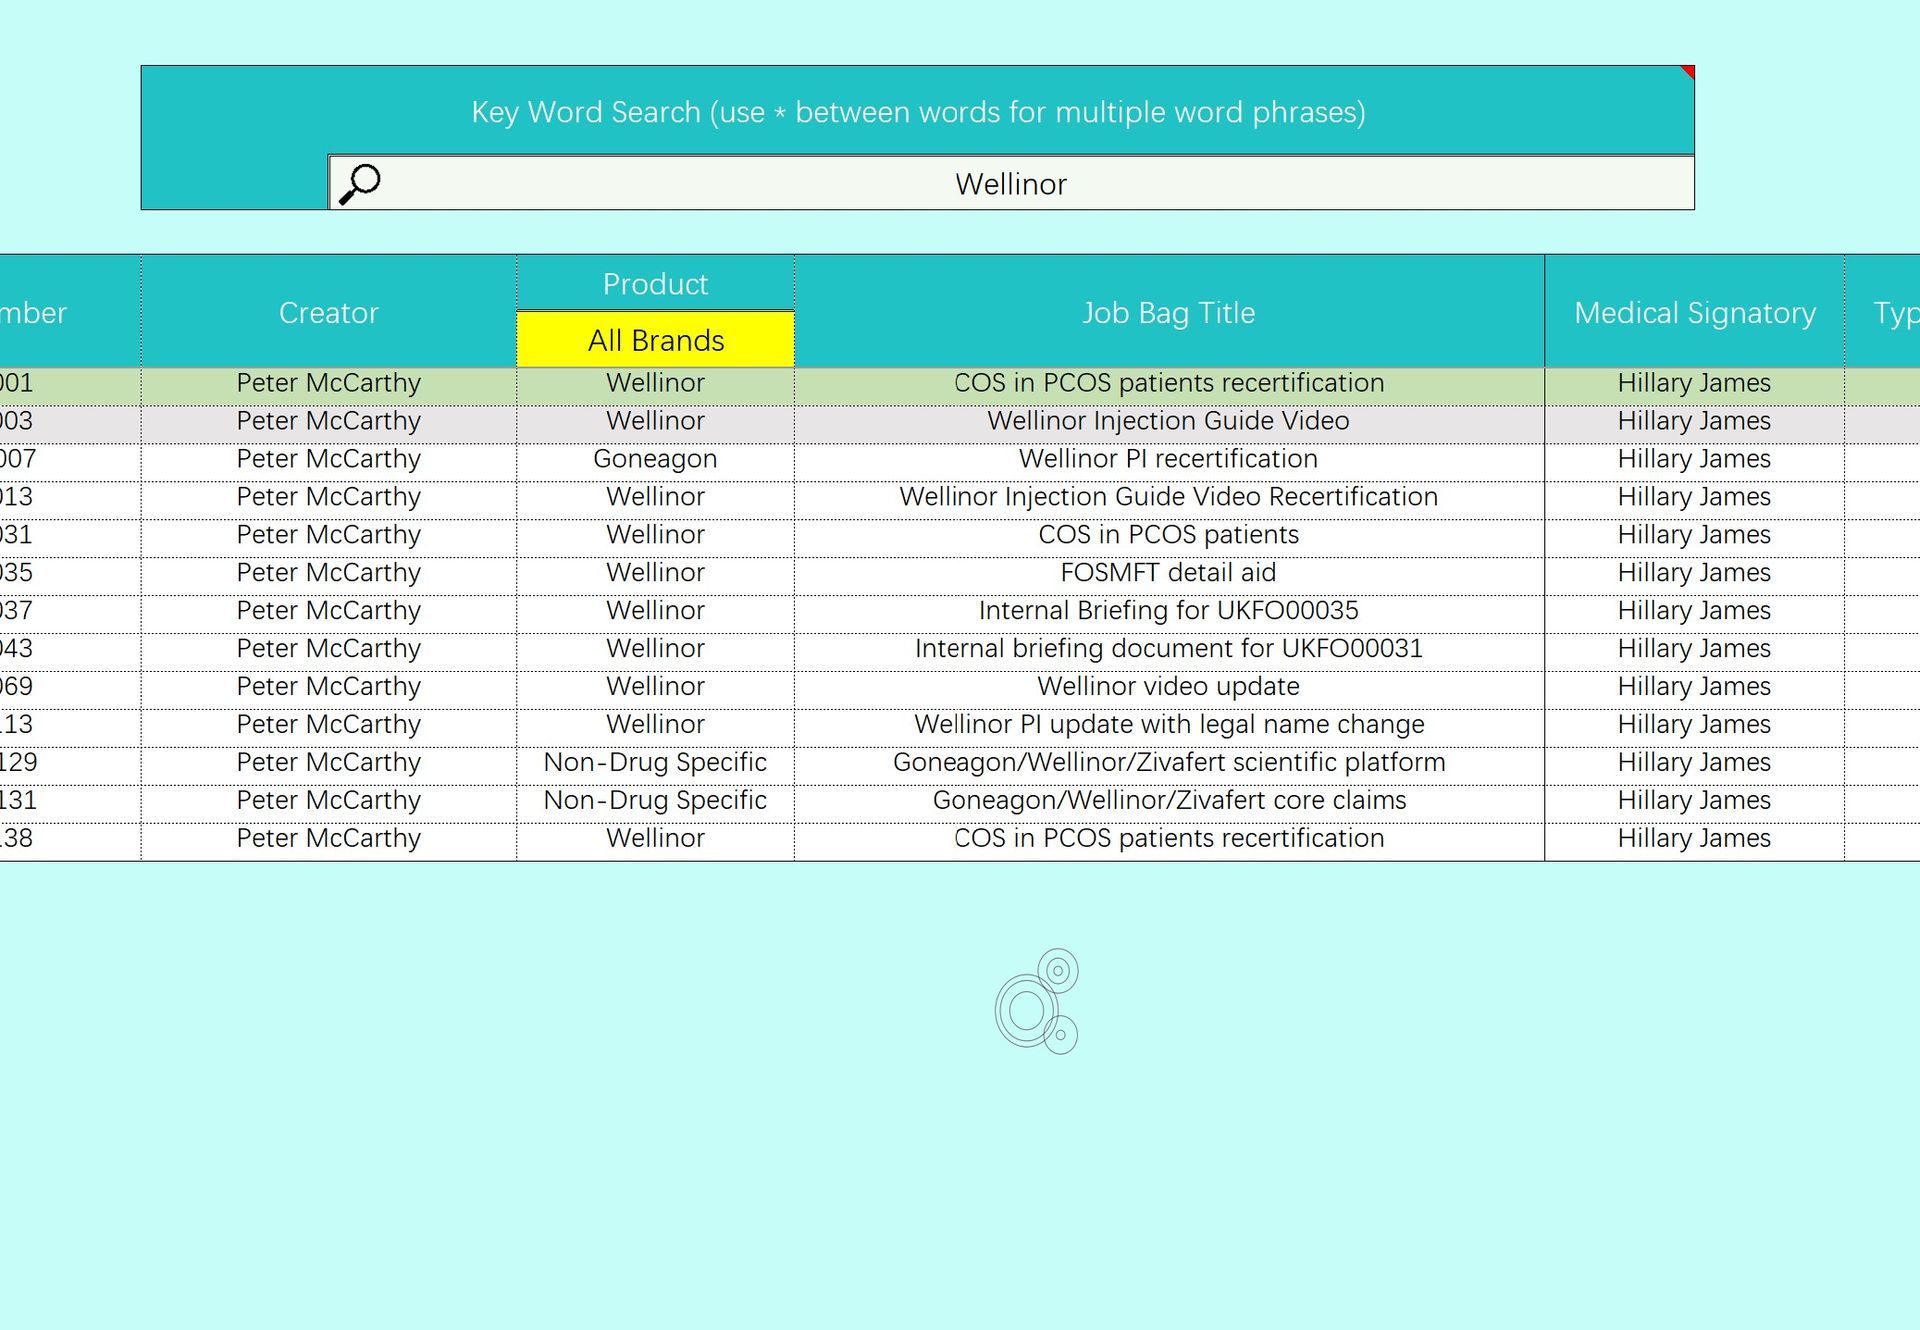
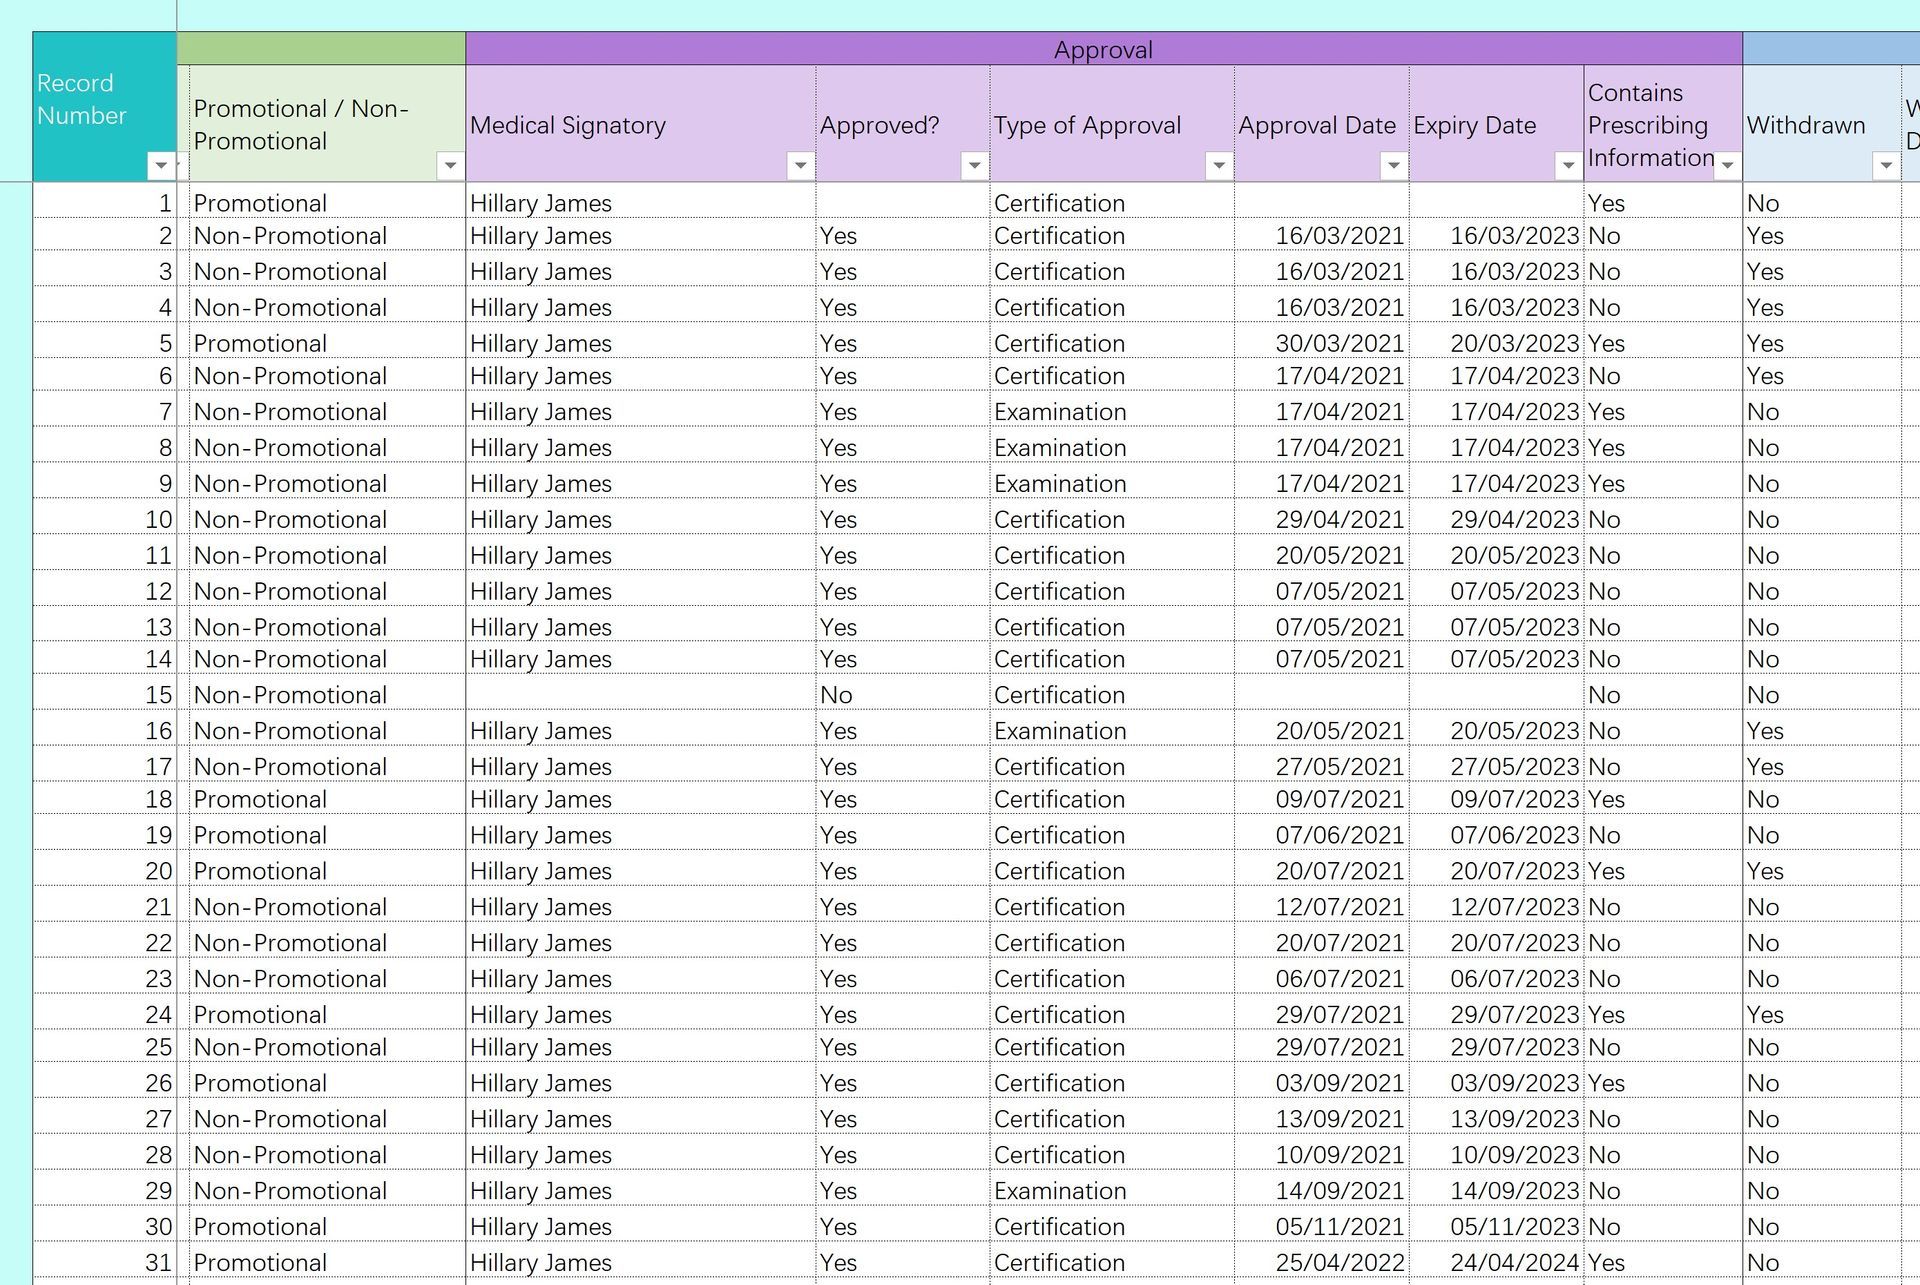
Job Bag Database
A small European Fertility company were looking for an automated way to create, store and monitor marketing item Job Bags. They wanted a tool that would generate unique Job Bag IDs, would allow tracking of the Job Bags through the sign off process, would enable users to identify all Job Bags nearing and past expiry and give them a way to present and store the data. They did not have the desire to spend tens of thousands on an unsuitable off the shelf package so we built them a cheap, intuitive and easy to use tool in Excel that was rolled out within 3 weeks
Project 10

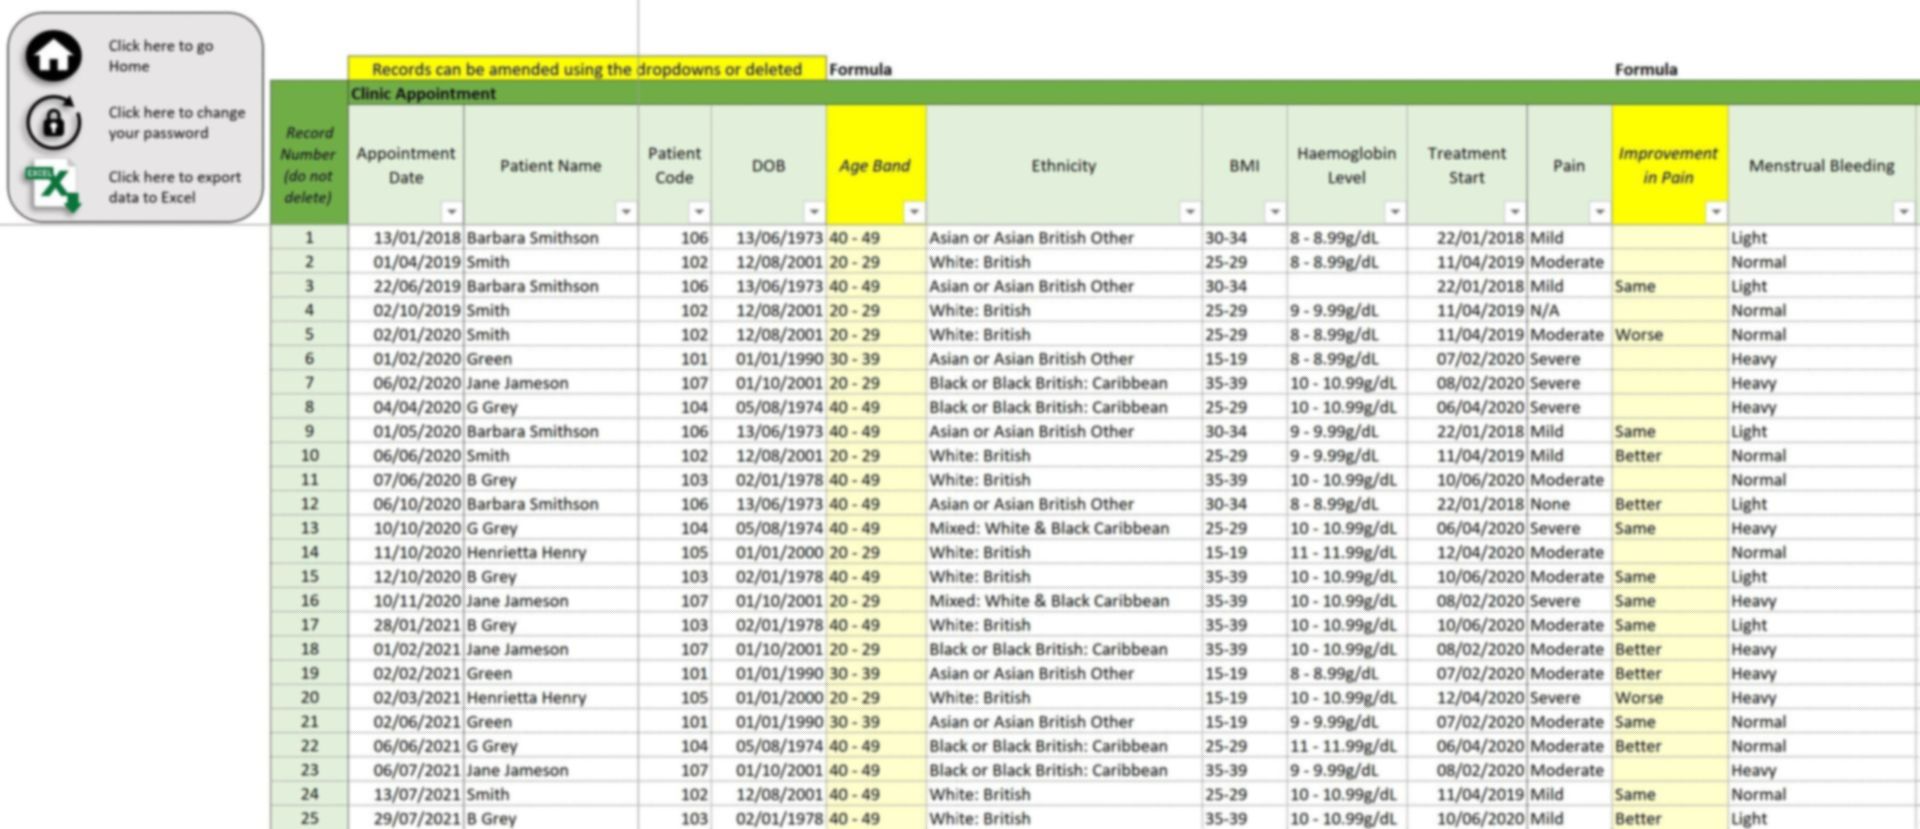
Patient Audit Tool
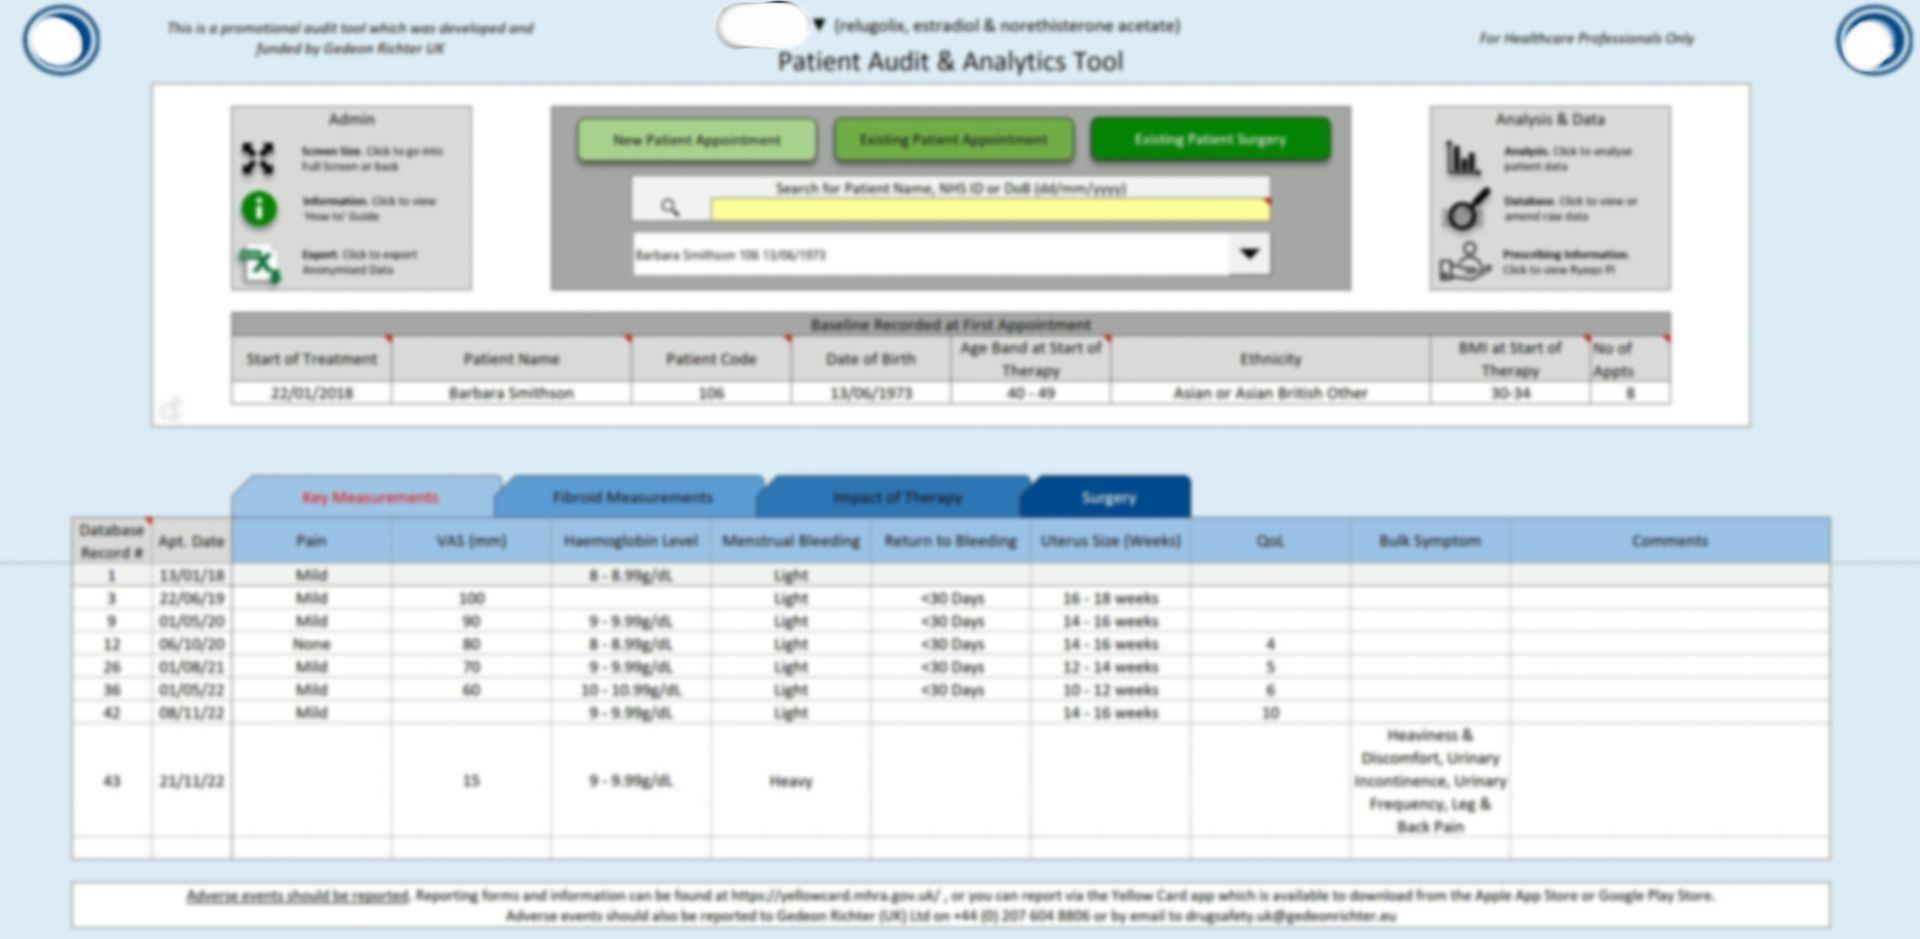
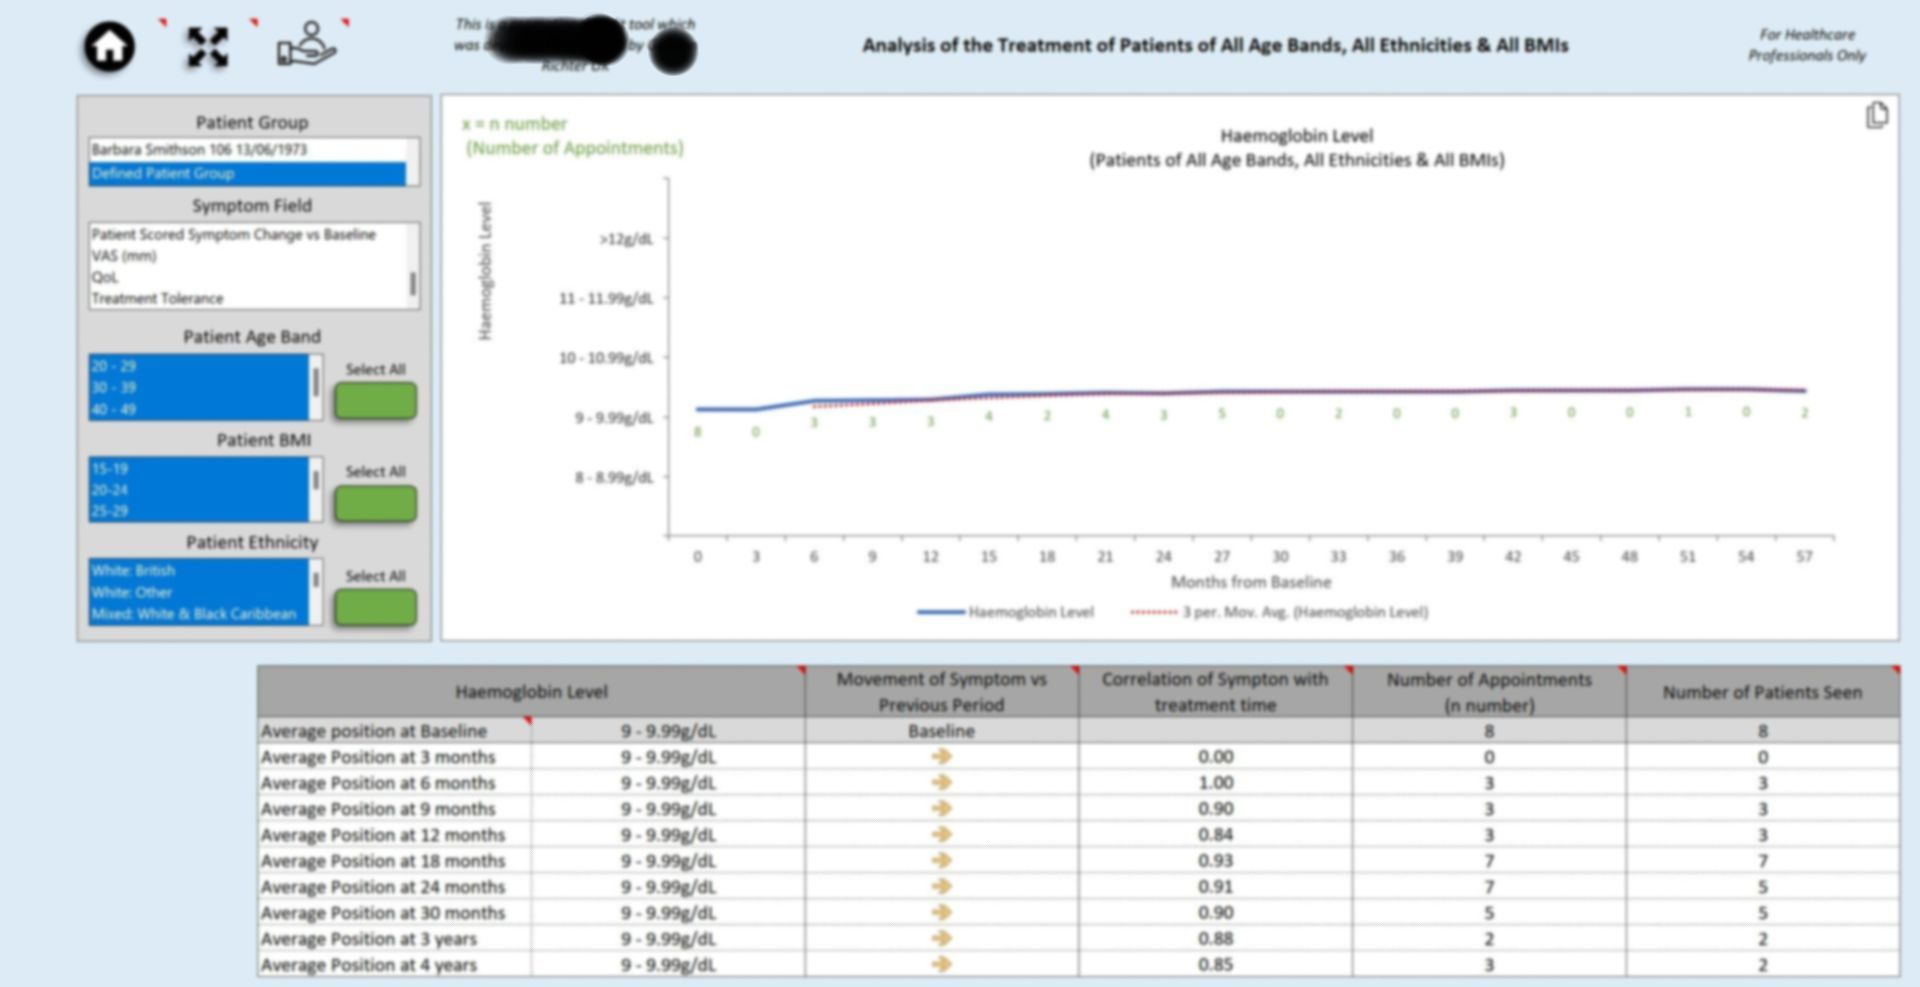
A Small Women's Health company working with the NHS wanted a tool that would allow physicians to record appointment details with patients, capture key metrics and observe changes over time.
We created a secure and intuitive tool requiring minimal training that captured the patients details and allowed easy searching for existing patients records as well as enabling the capture of any surgeries. It also allowed for the export of anonymised data, the analysis of disease progression over time, the monitoring and handling of adverse events and contained an in built user guide
Project 11
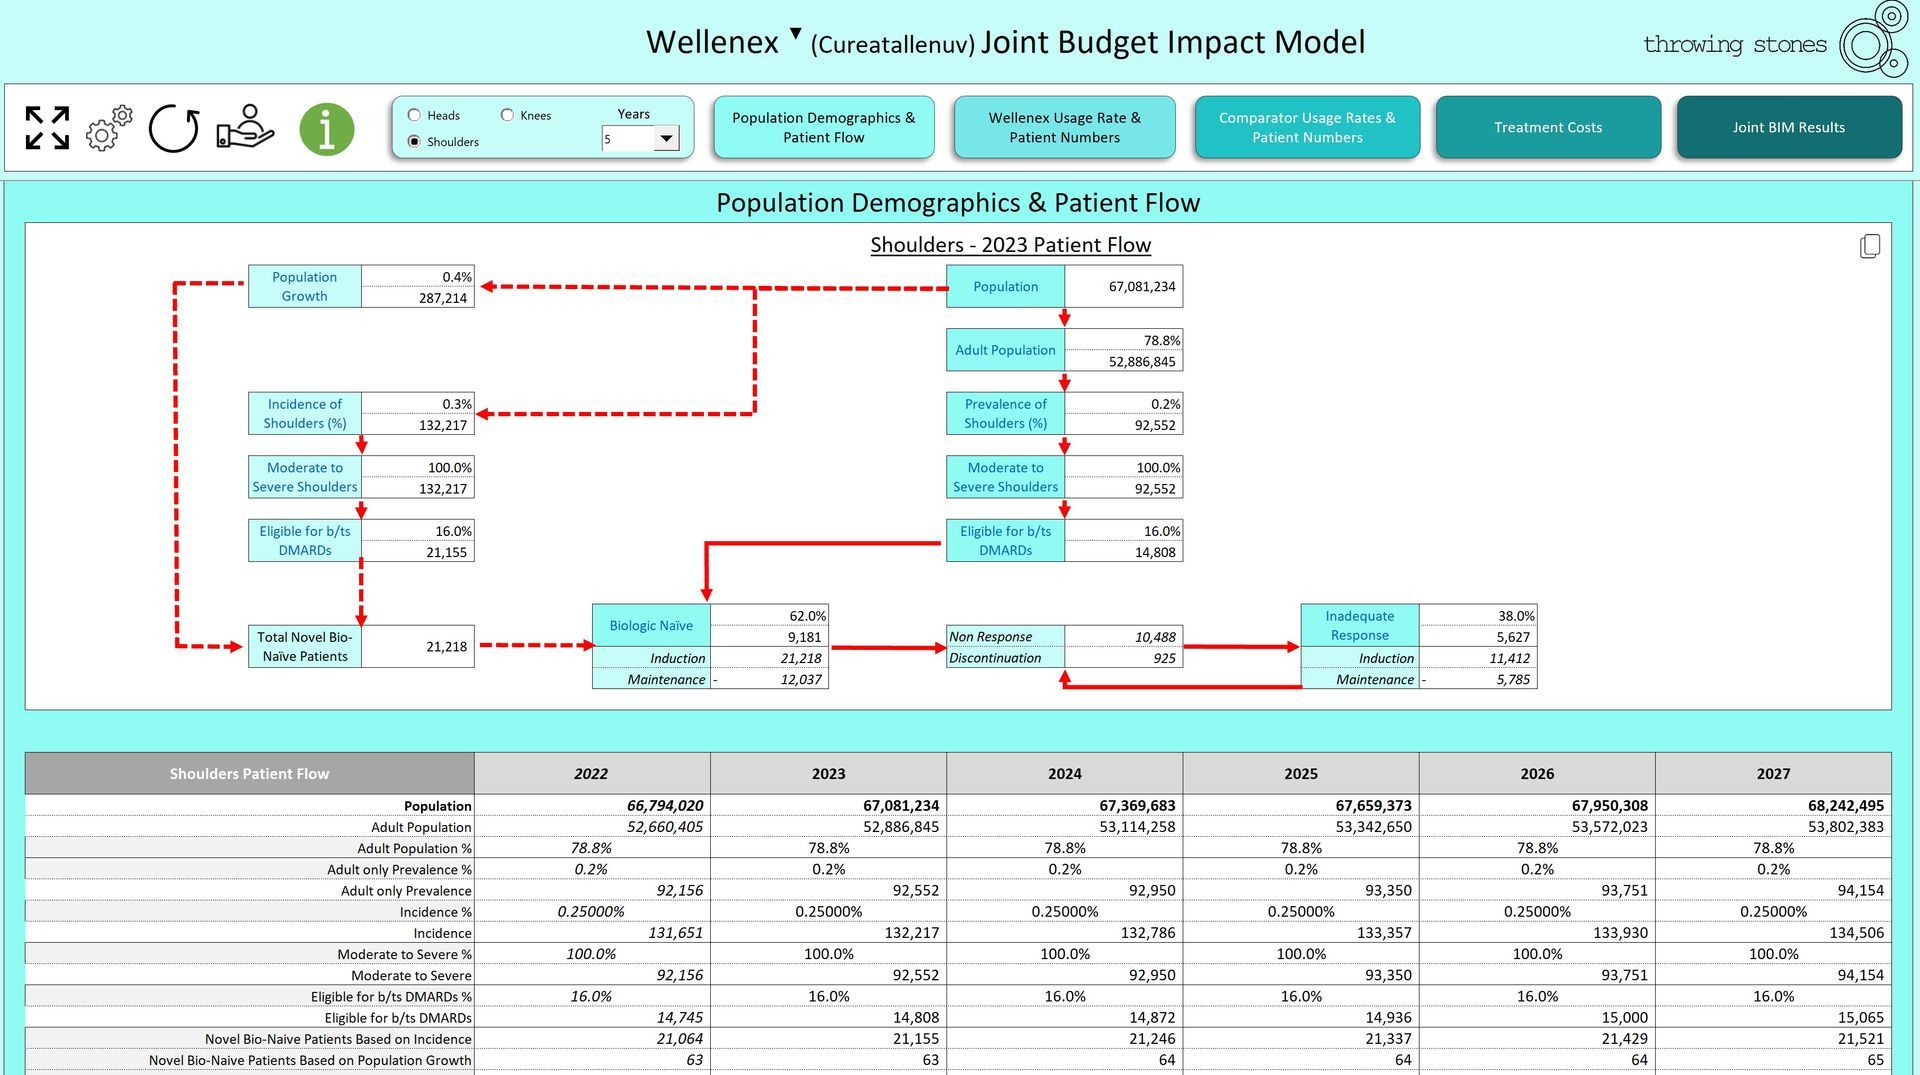
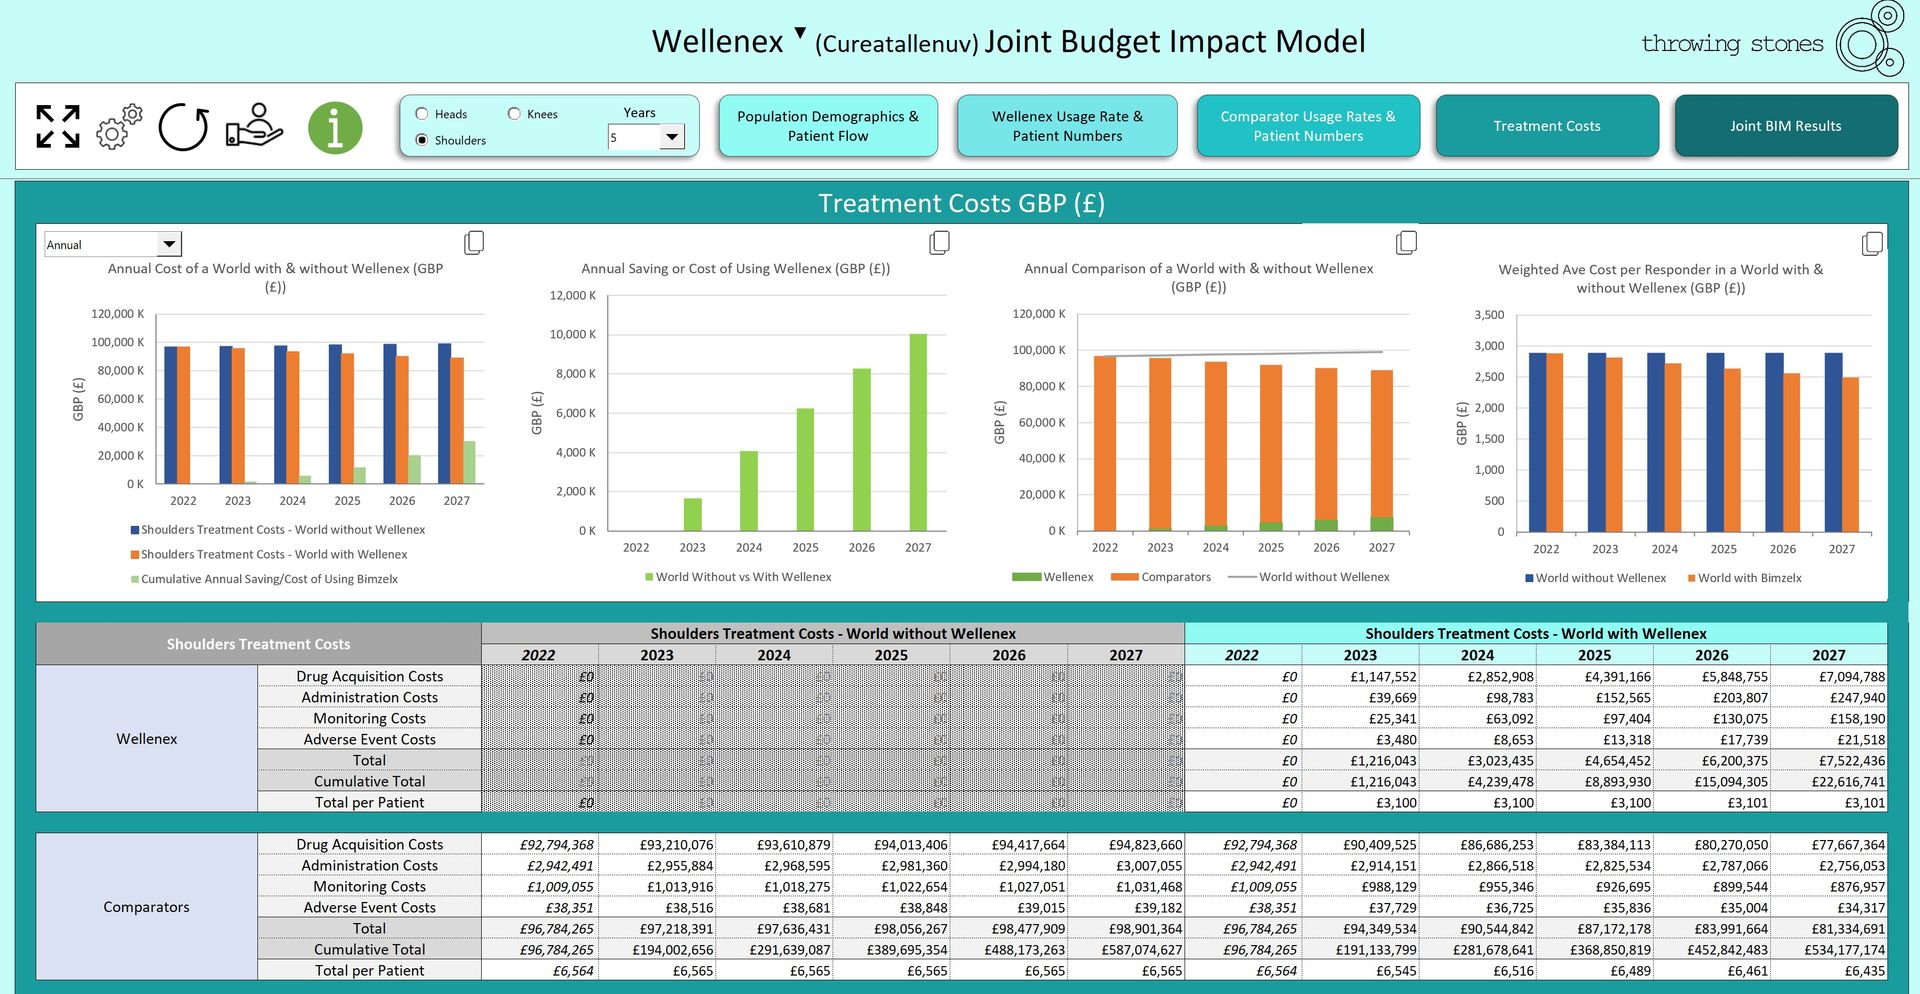
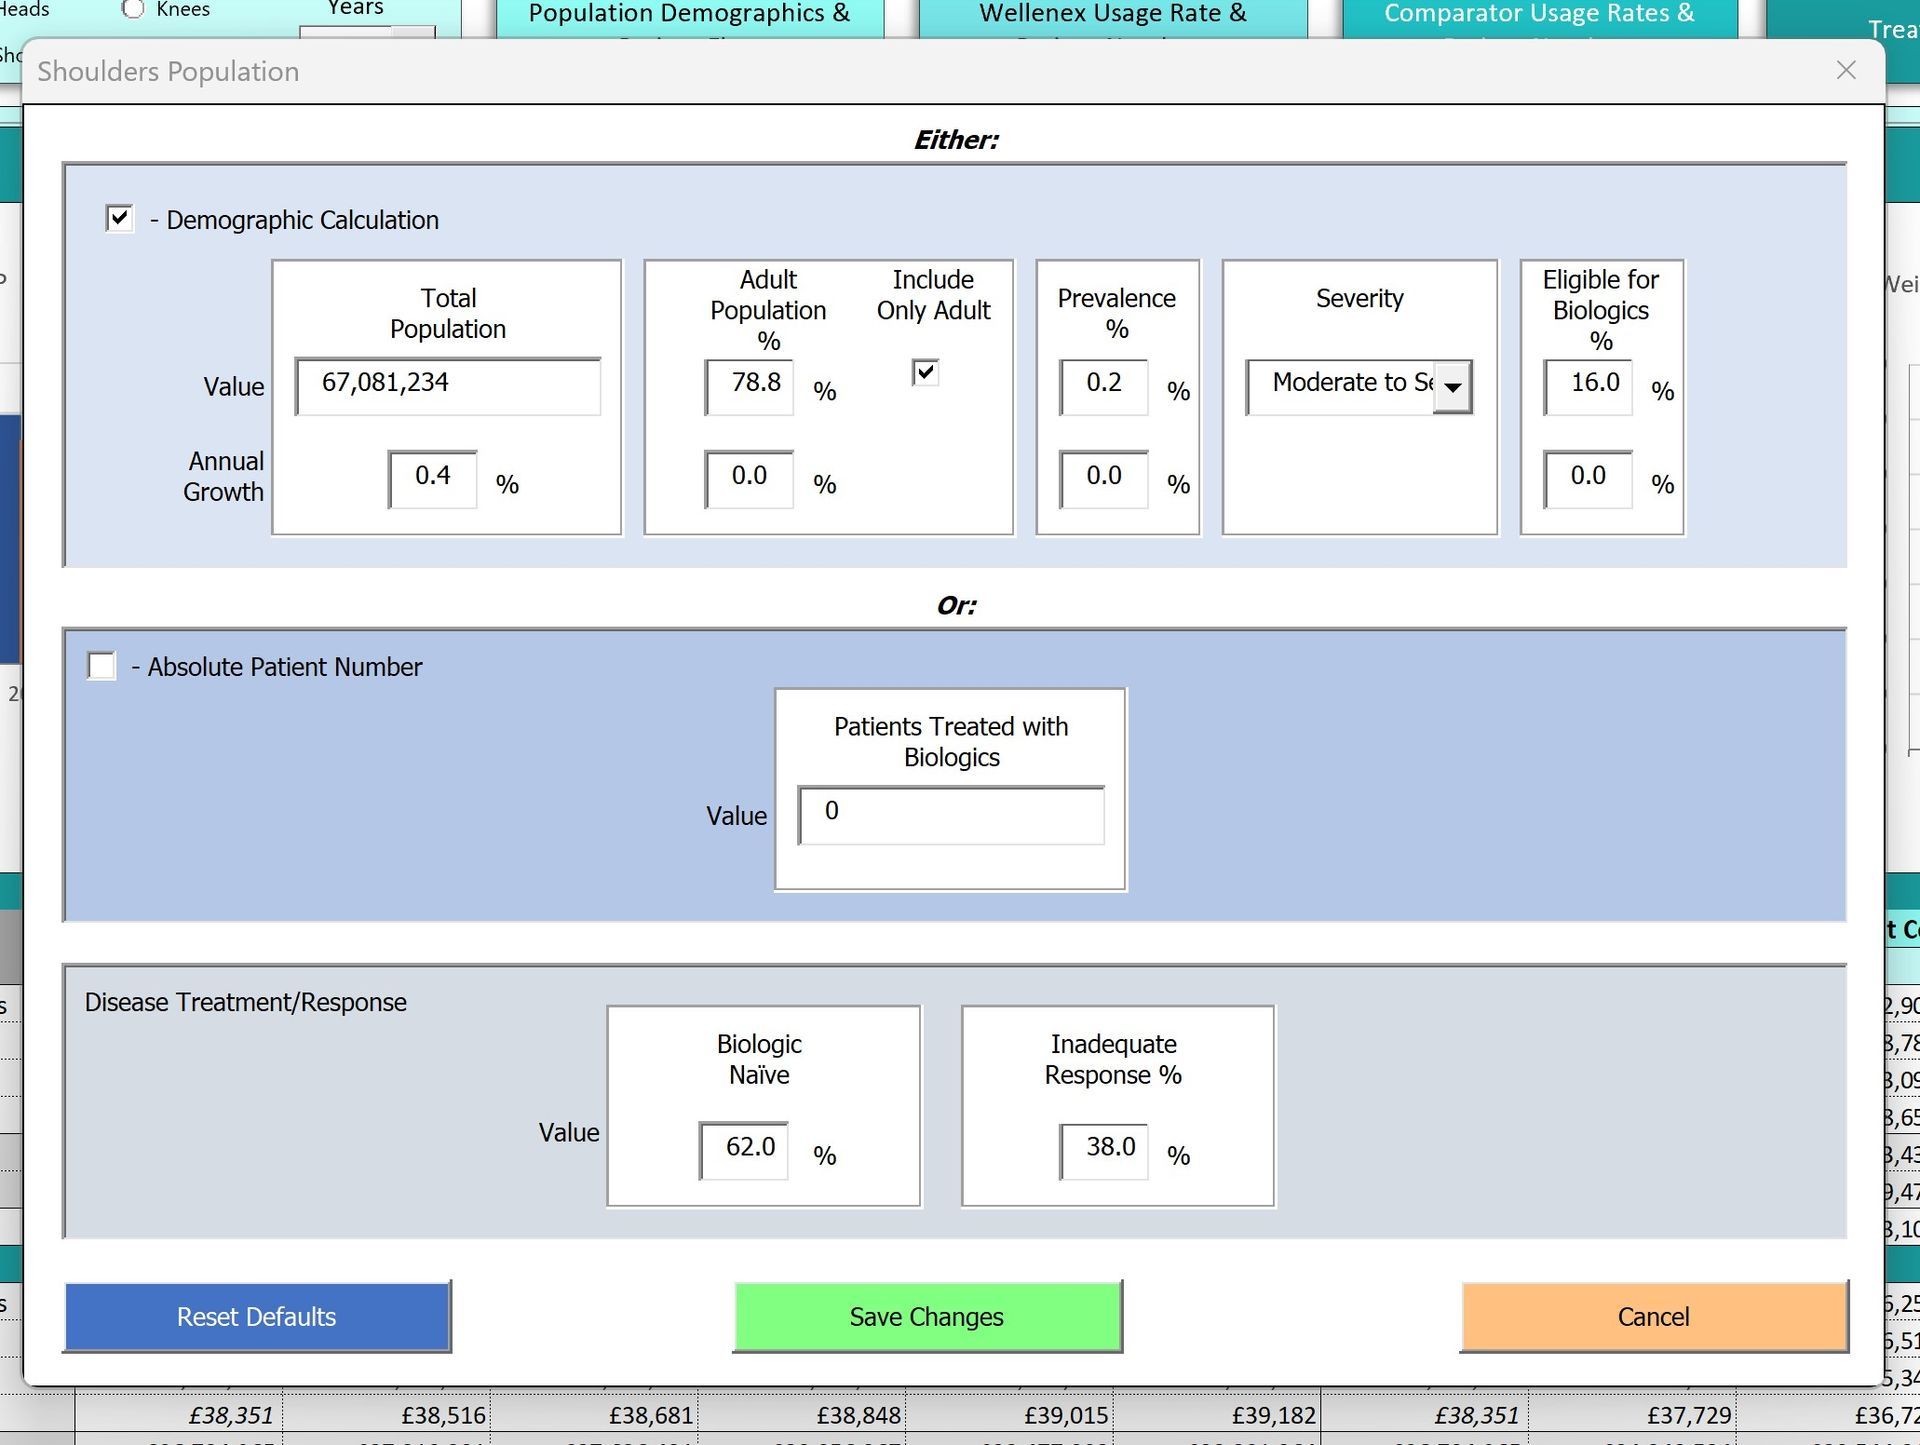
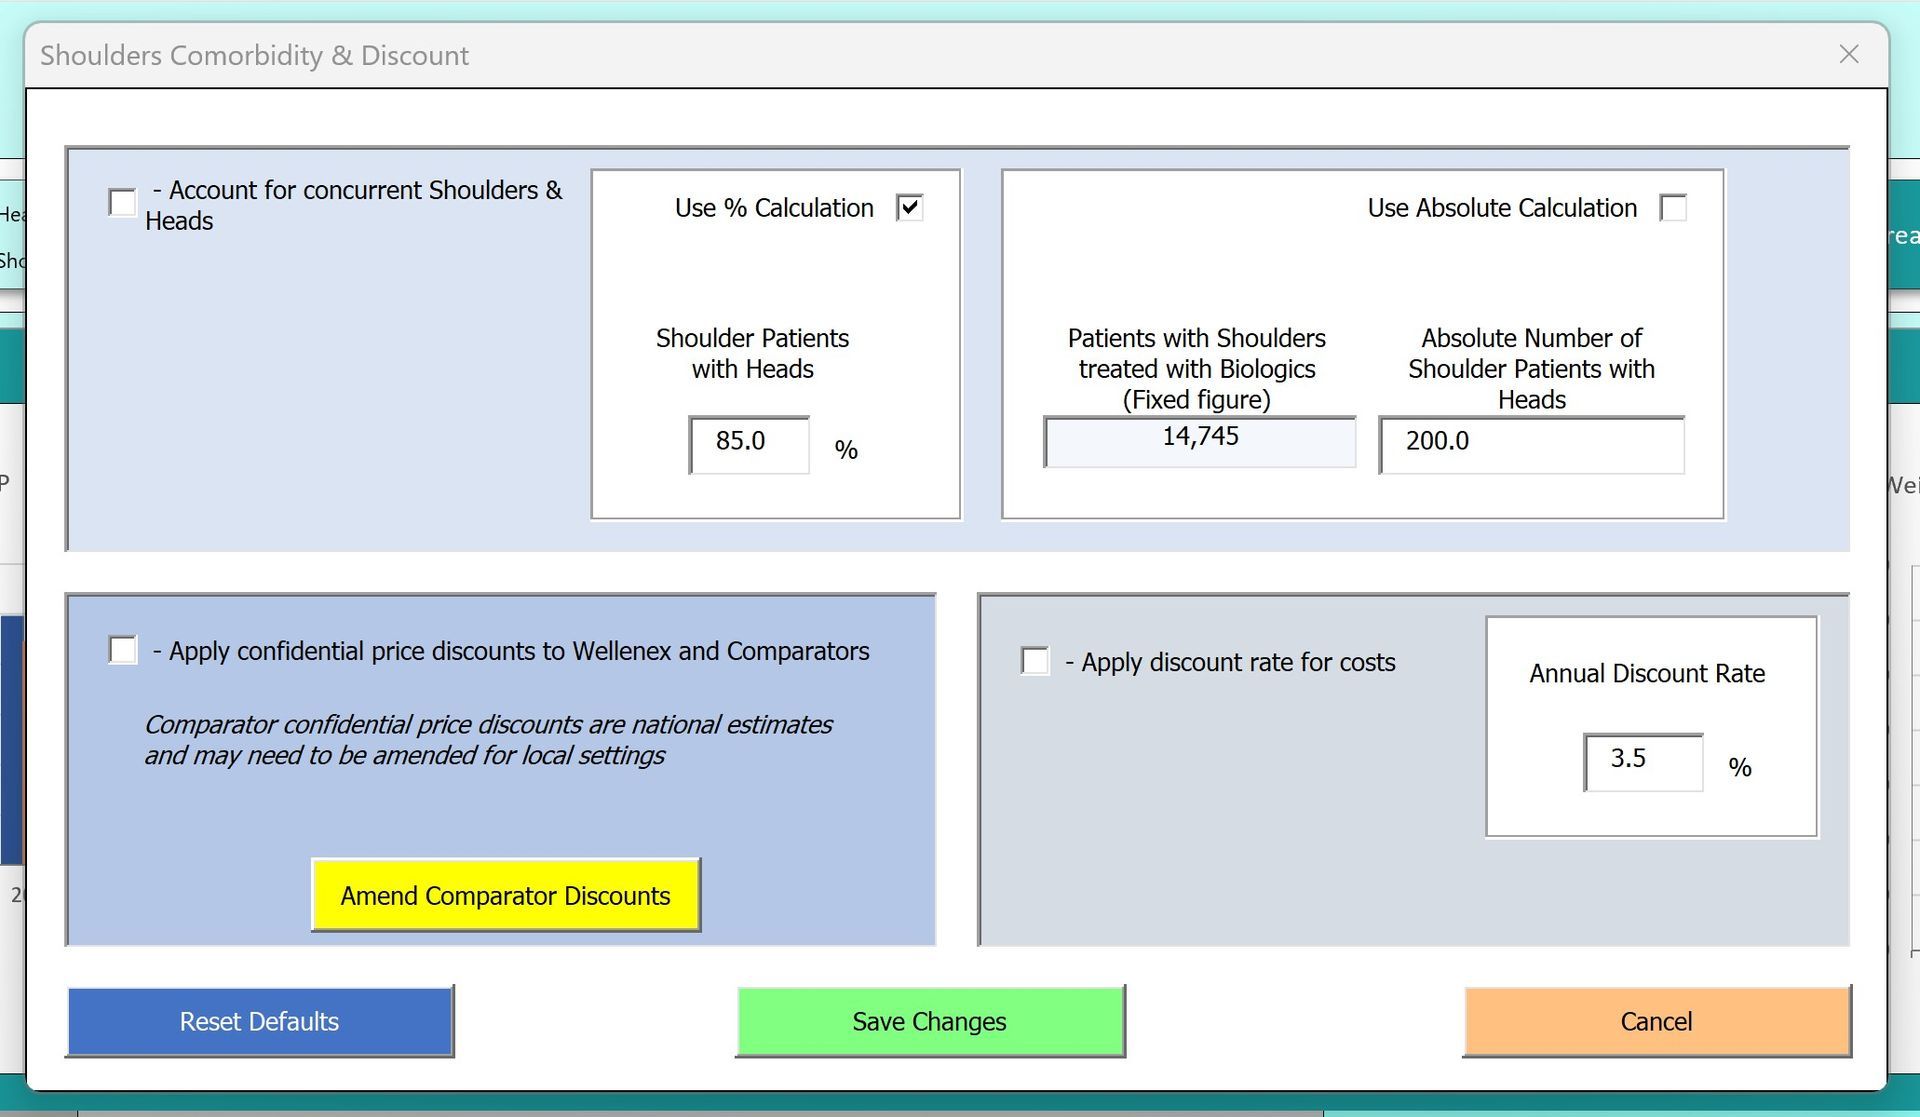
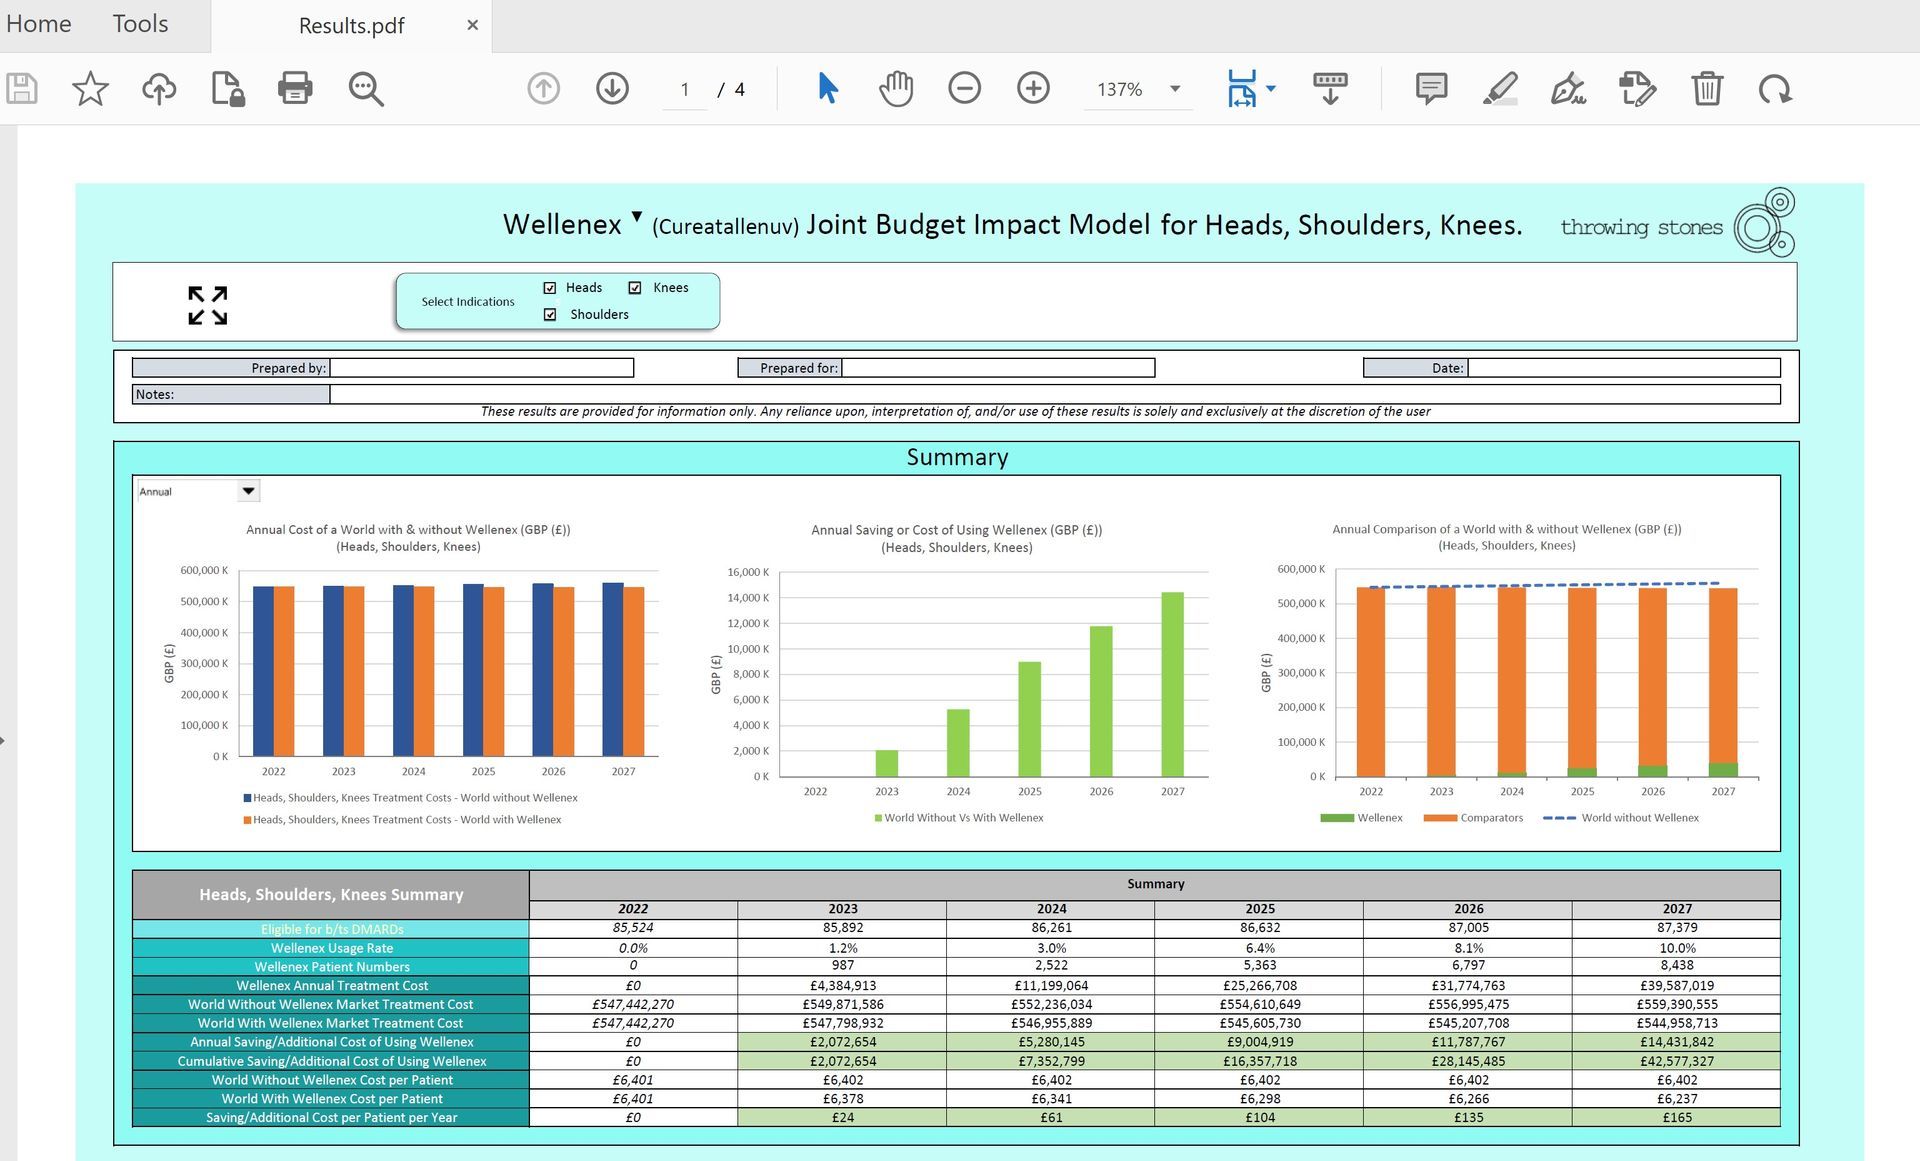
Business Impact Model
A Mid-sized European Pharma company were working towards launching a novel therapy. They had used traditional, data heavy, specialised Business Impact Models in the past but had found that their customers were not receptive as they were so complex. Their brief was to build a multi-indication BIM that could be used for one or all indications combined. They were keen to have a graphic model rather than a purely text and data driven one. However they did not want the outcomes to be any less robust than traditional models. We created a dynamic model that auto-updated instantly offering customers a great scenario building tool. We used Excel with VBA to allow the tool to be easily shared and used the forms functions to create an intuitive tool with a web-like interface. Heavy calculations were hidden from the end user, however the tool could easily be controlled by the administrators, inputting current data quickly